
The Market’s Feedback Loop Will Self-Destruct
And this is how they'll explain the next crash.

At some point, investors have to acknowledge what’s happening in this market. I don’t expect the rocket surgeons on CNBC to talk about it. Nor do I expect Jamie Dimon to write about it in his annual letter.
There’s a certain amount of kayfabe (hereinafter referred to as “lying to the public”) that makes up the top layer of public discourse about markets. It’s slick talk used to give the poors and commonfolk the impression things are operating totally normally even when they aren’t and when the aberrations have not shown up in the form of an easily identifiable shit show (i.e. massive crash) that everyone in the world is forced to acknowledge yet.
As I have started to pierce the veil about, this is obviously no longer a normal bull market driven by earnings growth, healthy economic expansion, or rational price discovery. We now have proof it is a market being mechanically forced higher by options flows, dealer hedging activity, and an AI-driven speculative frenzy that is beginning to resemble the most extreme periods of financial excess in modern history.
ZeroHedge highlighted the latest example after yesterday’s session, writing:
“Another massive gamma squeeze day as ‘spot up, vol up’: VIX soars on call buying as everyone rushes into the AI mania. Not even during the ‘Summer of 2020 SoftBank squeeze’ did we see such moves.”

“Thanks for the complex looking chart used by people smarter than me, Chris,” you’ll say to me. “I definitely, totally know what it means, but let me make sure that you do, too.”
Sure. What is means is this. Normally when stocks go up, the VIX (fear/volatility gauge) falls. This chart shows the unusual opposite—stocks are rising and VIX is staying high/rising because traders are aggressively buying call options on AI stocks, forcing market makers to buy more shares and helping drive a gamma squeeze higher.
In a normal market environment, rising stock prices tend to coincide with falling volatility. The rising VIX here likely suggests traders are also paying up for protection (or pricing in bigger future swings), which means the rally is being driven by speculative momentum but the market still sees elevated risk beneath the surface.
The VIX calculation — calculated from S&P 500 index option prices, specifically a wide range of out-of-the-money calls and puts that expire in roughly 23–37 days — uses both puts and calls, but historically VIX often rises when investors aggressively buy puts for downside protection.
As investors grow more confident (different from as stock prices move higher), demand for downside protection typically falls and the VIX moves lower. That relationship has historically been one of the market’s most reliable signals.
But that relationship is breaking down.
Stocks are surging higher while volatility is rising alongside them, a sign that speculative call buying has become so aggressive that market makers are being forced to hedge at increasingly higher prices. When traders aggressively buy calls, dealers often take the opposite side of those trades and are then forced to buy the underlying stocks or index futures to remain hedged. That hedging activity pushes prices even higher, which triggers even more call buying, creating a reflexive feedback loop that can become self-reinforcing.
Earlier this week, ZeroHedge pointed to another remarkable statistic:
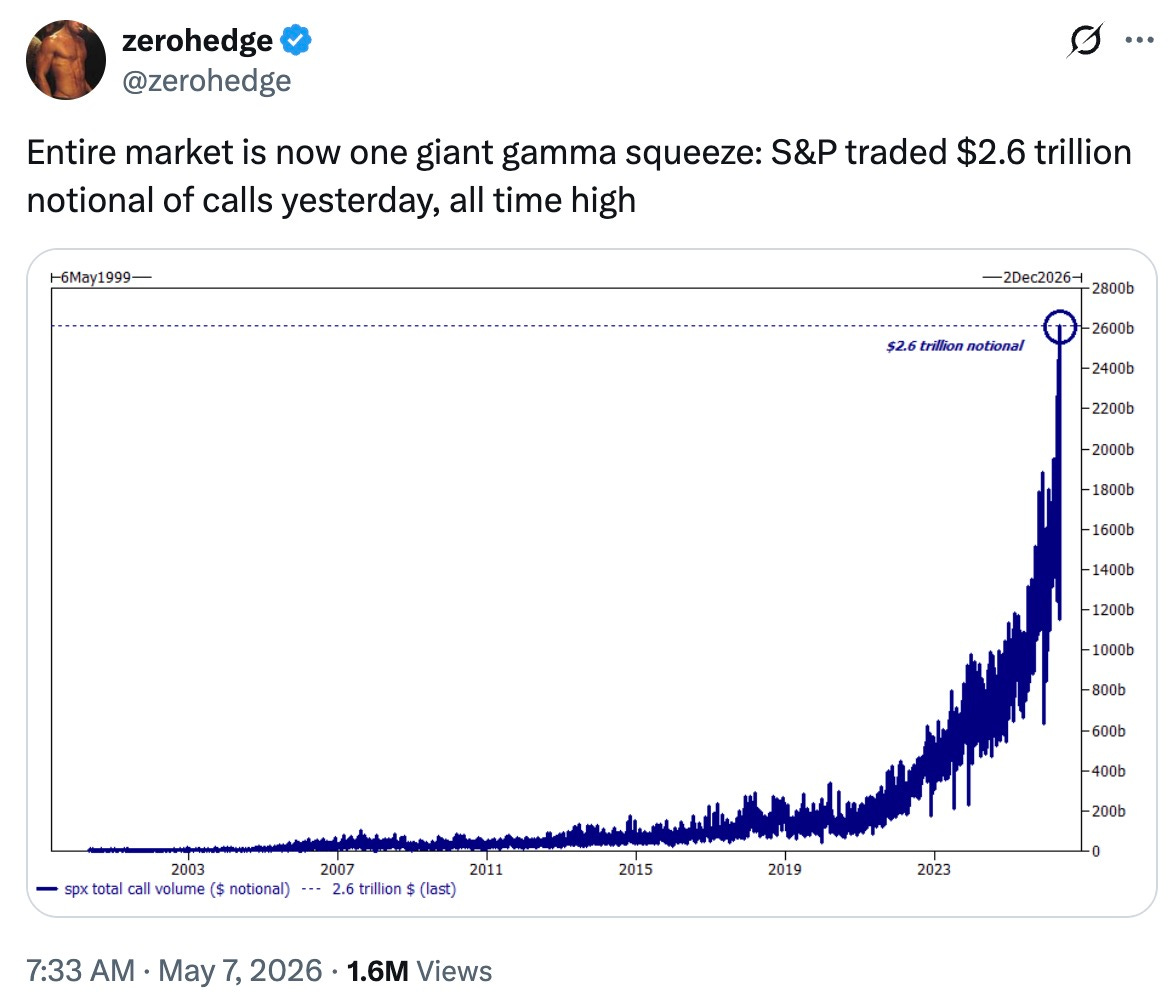
That number is staggering. It reflects a market increasingly dominated by derivatives activity rather than traditional investment behavior. This is no longer just retail traders gambling on weekly call options. Institutional investors, systematic funds, momentum traders, passive flows, and speculative retail capital all appear to be crowding into the same trade: mega-cap tech and AI.
That concentration has become increasingly dangerous because valuations are now reaching levels that are historically difficult to justify.
The Buffett Indicator, which compares total U.S. stock market capitalization to GDP, now sits at 229.9% as of May 5, 2026. That means the total value of the U.S. stock market is now more than double the size of the entire U.S. economy. Historically, readings above 100% have often suggested overvaluation. Readings above 150% have signaled extreme excess. At nearly 230%, this market is operating in territory that would have seemed unimaginable in previous cycles.
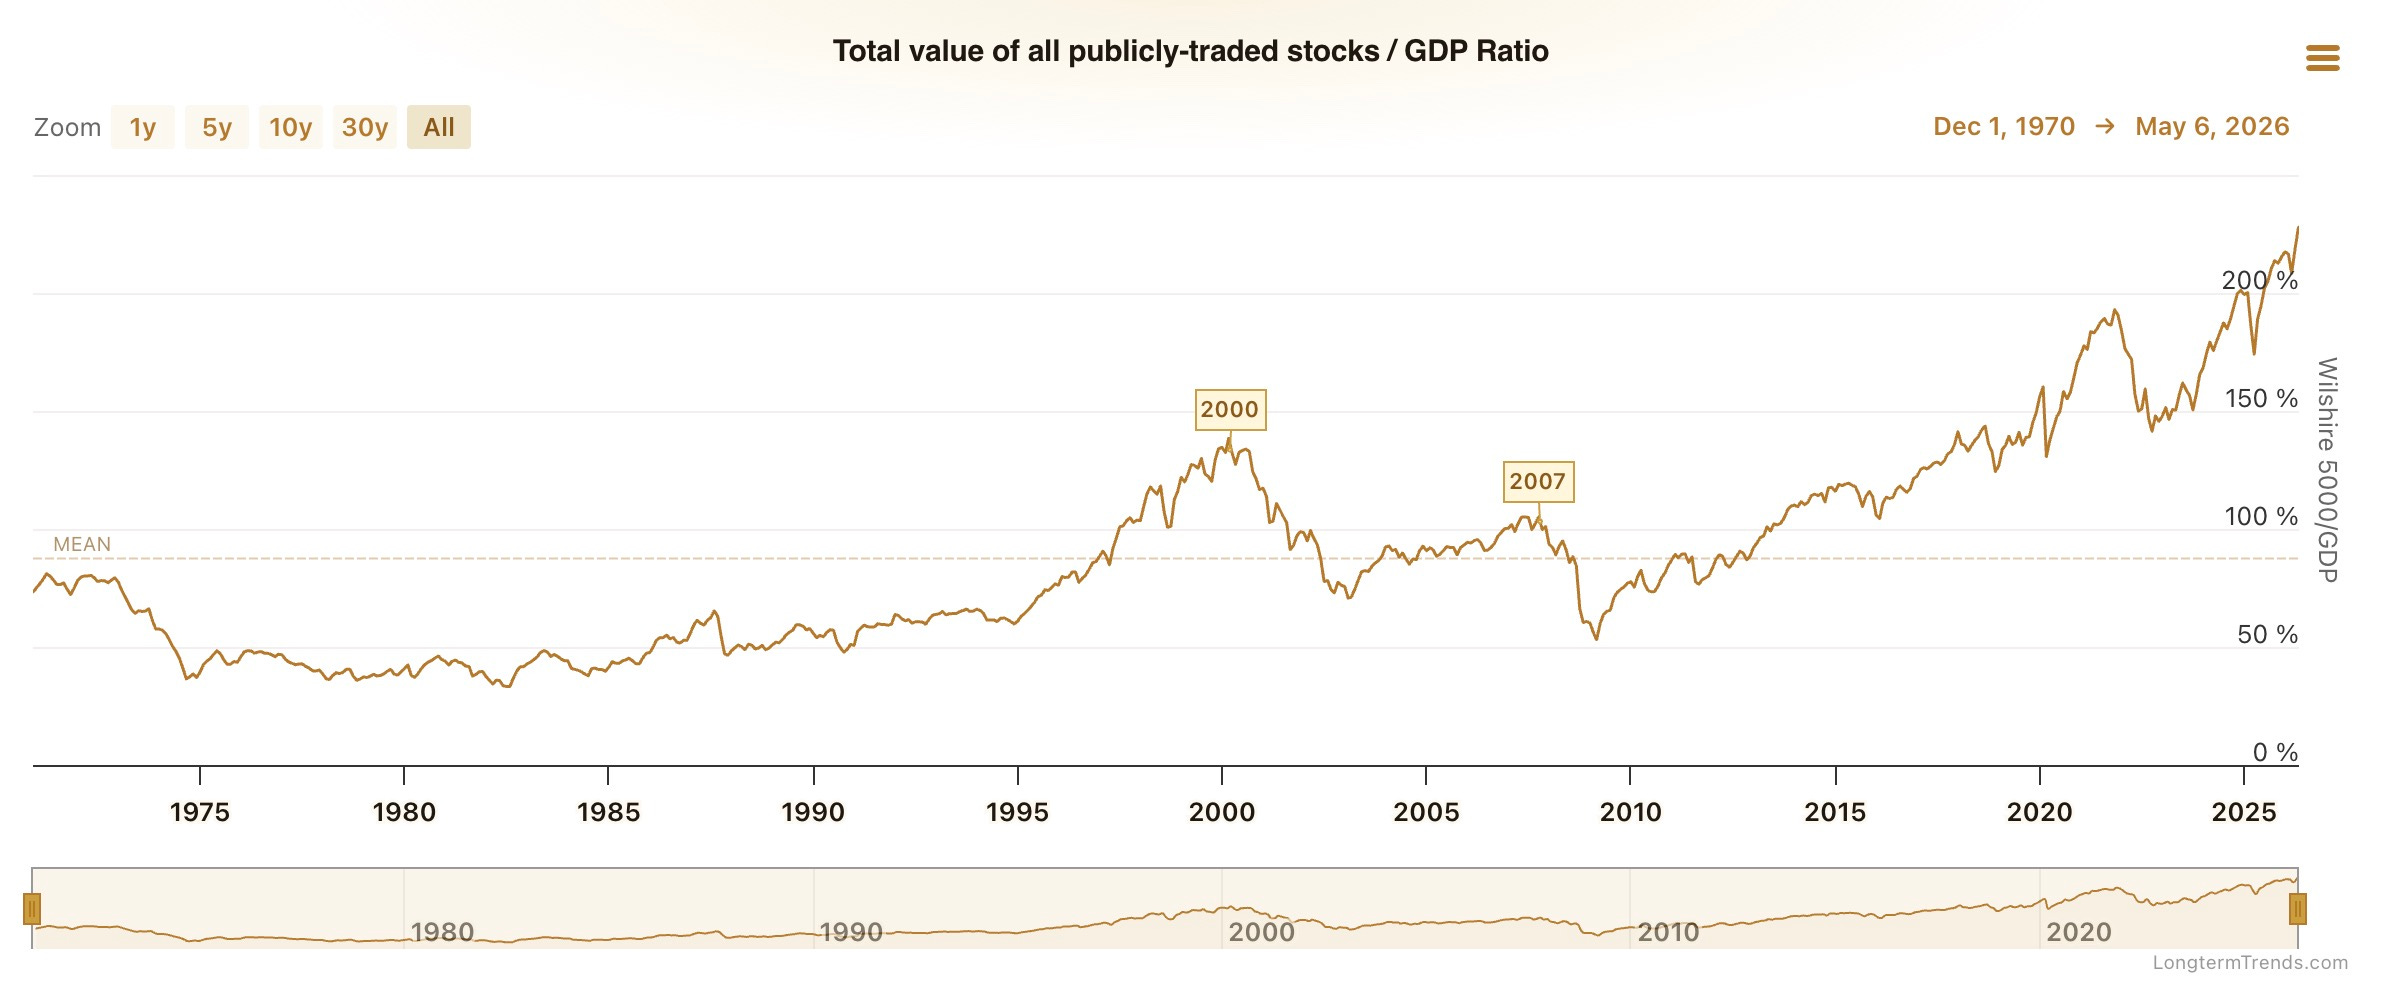
Investors may argue that today’s economy is more asset-light, more globalized, and more technology-driven than in prior decades. There is some truth to that. But even those structural changes do not fully explain why equity valuations continue pushing to such extraordinary levels.
The Shiller CAPE ratio tells a similar story. The current reading stands at 42.05, compared with a long-term average of 17.36 and a median of 16.07. The highest reading in history occurred during the peak of the dot-com bubble in December 1999, when the ratio reached 44.19. We are now approaching those same levels once again.
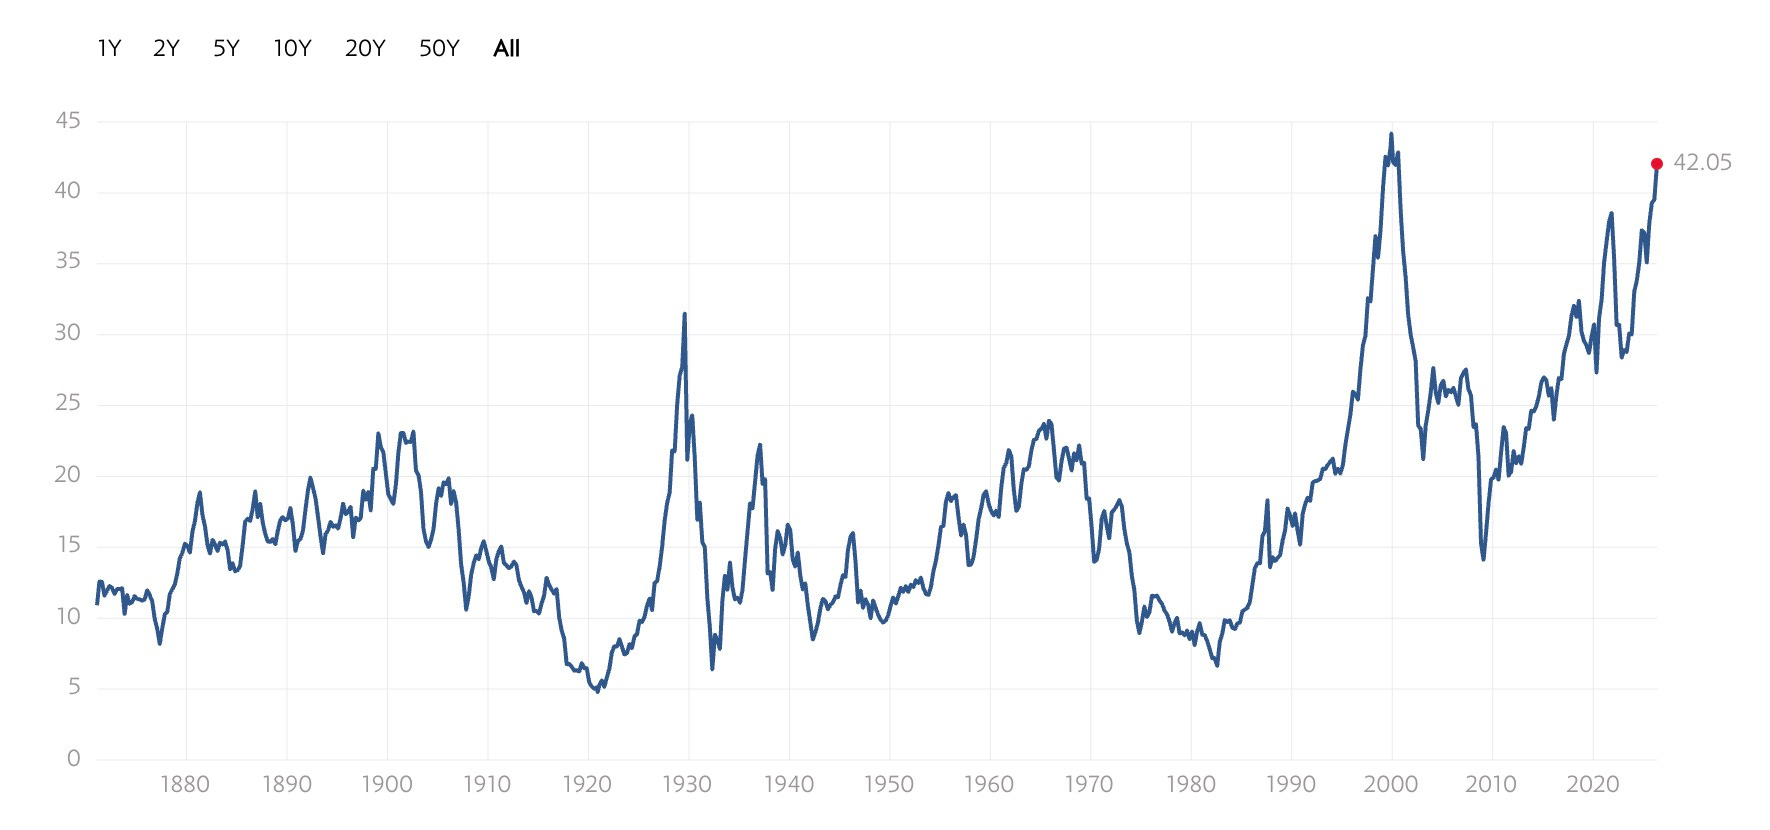
That comparison should make investors uncomfortable. The internet fundamentally changed the world. AI may do the same. But transformative technologies do not protect investors from overpaying. In fact, some of history’s greatest technological breakthroughs have coincided with some of history’s worst speculative bubbles because investors become convinced that traditional valuation frameworks no longer matter. Here’s Michael Burry offering up a stark analogue between the AI buildout and the 2000s tech bubble build out:

Every cycle eventually develops a narrative explaining why “this time is different.” In the late 1990s, it was the internet. In 2021, it was zero interest rates and infinite liquidity. Today, it is AI. Hell, even I have speculated as to whether or not the market is now permanently distorted:

As I noted in my piece “The Permanent Distortion Theory”, perhaps the biggest question is whether central banks have permanently changed market behavior.
After years of quantitative easing, repeated interventions, and a widespread belief that policymakers will always step in during periods of instability, investors may have been conditioned to treat every correction as temporary and every bubble as sustainable.
If liquidity backstops continue to distort risk pricing, it raises an uncomfortable question: are bubbles no longer rare events? Have they become the default state of modern financial markets? That may ultimately be the most important debate of this cycle.
But investors should not confuse structural changes with the elimination of risk. Even in an era of endless liquidity support, valuation still matters eventually. Excess still unwinds eventually. Speculative manias still break eventually. The further we push this market-wide gamma squeeze higher, the further back it has to snap and crash…and the quicker it will happen. This means even if the Fed says same day they’re bailing out the market, it still won’t be quick enough. A chain reaction of margin calls, put gamma, deleveraging and other market events that make retail puke up pieces of their own colons will have already taken place.
So yes, this is a bubble. The only real question is how much longer it can continue inflating before reality reasserts itself.
Pardon this broken record but for investors, that should be a signal to exercise caution. Chasing parabolic moves fueled by leverage and options momentum may feel safe while prices are rising, but history repeatedly shows that the final stages of a bubble are often the most dangerous. Protect capital, stay disciplined, and remember that preserving wealth matters far more than squeezing out the last few percentage points of upside before the cycle turns.
To quote the sign above the cash register at my favorite Korean deli in Philadelphia: “You never need patience more than when you are about to lose it.”

QTR’s Disclaimer: Please read my full legal disclaimer on my About page here. This post represents my opinions only. In addition, please understand I am an idiot and often get things wrong and lose money. I may own or transact in any names mentioned in this piece at any time without warning. Contributor posts and aggregated posts have been hand selected by me, have not been fact checked and are the opinions of their authors. They are either submitted to QTR by their author, reprinted under a Creative Commons license with my best effort to uphold what the license asks, or with the permission of the author.
This is not a recommendation to buy or sell any stocks or securities, just my opinions. I often lose money on positions I trade/invest in. I may add any name mentioned in this article and sell any name mentioned in this piece at any time, without further warning. None of this is a solicitation to buy or sell securities. I may or may not own names I write about and are watching. Sometimes I’m bullish without owning things, sometimes I’m bearish and do own things. Just assume my positions could be exactly the opposite of what you think they are just in case. If I’m long I could quickly be short and vice versa. I won’t update my positions. All positions can change immediately as soon as I publish this, with or without notice and at any point I can be long, short or neutral on any position. You are on your own. Do not make decisions based on my blog. I exist on the fringe. If you see numbers and calculations of any sort, assume they are wrong and double check them. I failed Algebra in 8th grade and topped off my high school math accolades by getting a D- in remedial Calculus my senior year, before becoming an English major in college so I could bullshit my way through things easier.
The publisher does not guarantee the accuracy or completeness of the information provided in this page. These are not the opinions of any of my employers, partners, or associates. I did my best to be honest about my disclosures but can’t guarantee I am right; I write these posts after a couple beers sometimes. I edit after my posts are published because I’m impatient and lazy, so if you see a typo, check back in a half hour. Also, I just straight up get shit wrong a lot. I mention it twice because it’s that important.
Good points, and of course there will be a reckoning, at some point. When has there not been? This has been an extraordinary run in the last 5-6 weeks, +17% on the SPX, much. much more in certain sub-indices. The latter are in for some serious volatility, perhaps as early as Monday. However, for many of the structural reasons you name, and many others, a major Bear is still some time away, perhaps next year. One of my pet theses is that the next real catastrophic financial crack-up will finally mark the shift to the Century of China. As usual, we'll see...
Lot's of writers cover the Buffet indicator or CAPE showing the market way over valued. What I really appreciate about QTR is exploring why it is still headed up. And why it could continue steaming forward. It all adds to the unpredictability of when the iceberg will be revealed. Really appreciate your perspective. Even when I don't agree the disclaimer never fails to make me laugh.