There's No Way This Everything Bubble Can't Implode When Facing 5% Rates: Mark Spiegel
Friend of Fringe Finance Mark B. Spiegel of Stanphyl Capital released his most recent investor letter on May 31, 2023, with his updated take on the market’s valuation and Tesla.
Friend of Fringe Finance Mark B. Spiegel of Stanphyl Capital released his most recent investor letter on May 31, 2023, with his updated take on the market’s valuation and Tesla.
Mark is a recurring guest on my podcast and definitely one of Wall Street’s iconoclasts. I read every letter he publishes and only recently thought it would be a great idea to share them with my readers.
Like many of my friends/guests, he’s the type of voice that gets little coverage in the mainstream media, which, in my opinion, makes him someone worth listening to twice as closely.
Mark was kind enough to allow me to share his thoughts from his May 2023 investor letter (edited slightly for length and grammar by QTR). This letter also contains positions his fund has on, both long and short.
Mark On Markets
Friends and Fellow Investors:
For May 2023 the fund was down approximately 10.8% net of all fees and expenses. By way of comparison, the S&P 500 was up 0.4% and the Russell 2000 was down 0.9%. Year-to-date the fund is down approximately 19.0% net. By way of comparison, the S&P 500 is up 9.6% and the Russell 2000 is unchanged. Since inception on June 1, 2011 the fund is up approximately 142.6% net while the S&P 500 is up 293.4% and the Russell 2000 is up 142.9%. Since inception the fund has compounded at approximately 7.7% net annually vs 12.1% for the S&P 500 and 7.7% for the Russell 2000. (The S&P and Russell performances are based on their “Total Returns” indices which include reinvested dividends. Investors will receive exact performance figures from the outside administrator within a week or two. Please note that individual partners’ returns will vary in accordance with their high-water marks.)
Despite this year’s egregiously bad performance, this fund has been in much bigger holes than the current one and has always dug out of them, and I have every intention of doing so again. Here’s how…
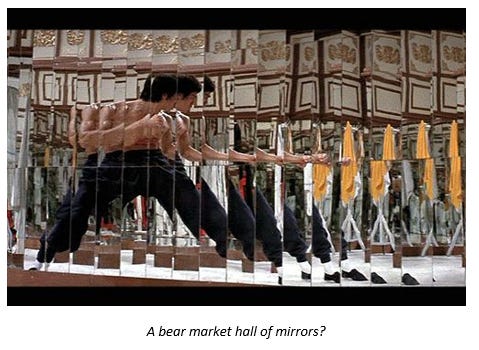
"In bear markets… investors lose confidence. They start to question their processes as the price action and crosscurrents in the data create a hall of mirrors that increases their confusion. This is precisely the time to trust your own work and ignore the noise.”
--Mike Wilson, Chief Investment Officer at Morgan Stanley
May was indeed an Enter the Dragon-style “hall of mirrors” for our bearish positioning, but I believe that in the second half of this year we’ll be Bruce Lee and the bulls will be Mr. Han. I explain why below…
…but first I’ll point out that in late May, Tesla (a large short position that was up 24% in May on a call-option gamma squeeze in the face of increasingly poor fundamental news) was discovered to have conducted the largest safety cover-up in automotive history, a story that has so far been ignored by most major U.S. media, but one that I believe will have devastatingly long legs. (There’s much more on Tesla later in this letter.) And now, back to “the big picture”…
Counterintuitively, stocks were (temporarily!) supported in May by the lack of a debt ceiling deal accompanied by the certainty that one would materialize, as the absence of normal, liquidity-draining net Treasury debt issuance became the market equivalent of massive “quantitative easing” that more than offset the Fed’s current “quantitative tightening.” The imminent resumption of such issuance in early June (once the debt ceiling deal is ratified) will create an immediate liquidity drain that will roughly double the Fed’s current pace of “quantitative tightening.” I believe that this, combined with massive developing economic storm clouds, will plunge stocks back into the abyss, resuming a fierce bear market. As I’ve written here before:
There’s no way an “everything bubble” built on over a decade of 0% interest rates and trillions of dollars of worldwide “quantitative easing” can not implode when confronted with 5%+ rates and $95 billion/month in U.S. quantitative tightening (plus increasingly tight money from the ECB and other central banks as well as the newly upsized Treasury debt issuance).
As for those developing economic storm clouds…
1) Although the excess savings built up during the Covid pandemic is still putting somewhat of a floor under consumer spending, those funds should be fully depleted by year-end, and consumer credit card balances are already showing signs of stress.
2) This summer, student loan repayments will finally resume, creating a new drain on consumer spending.
3) Small business sentiment, business lending data, shipping costs and other leading indicators say that a nasty recession is imminent, and the mild fiscal constraint imposed by the debt-ceiling agreement will do nothing to prevent it.
We thus continue to be short a large amount of SPY, as even a possible Fed interest rate “pause” at a bit over 5% makes current stock market valuations unsustainable, as stocks are still expensive. According to Standard & Poor’s latest data (as of May 25th), TTM operating earnings for the S&P 500 came in at $200.49. A 16x multiple on those earnings (generous for the current environment) would put that index at just 3208 vs. its May close of 4179, while 15x would put it at 3007. And remember, just as in bull markets PE multiples usually overshoot to the upside, in bear markets they often overshoot to the downside. Thus, a bottom formed at a lower multiple is not unfathomable.
Although the high current rates of 5.5% core CPI and a reaccelerating 4.7% core PCE are likely unsustainable, I believe we’re in for a new core “inflation floor” of 3% to 4% as China reopens its economy post-Covid, Biden continues his war on fossil fuels, the U.S. government continues to rack up massive deficits, and substantial wage increases continue due to fewer available workers combined with “onshoring” jobs previously sent overseas. And even as inflation gradually declines, the Fed does not want to reverse rates too soon and repeat the 1970s.
Meanwhile, for some historical perspective on inflation vs. stocks, keep in mind that when the 2000 bubble burst and the Nasdaq was down 83% through its 2002 low and the S&P 500 was down 50%, the rates of CPI inflation were just 3.4% in 2000, 2.8% in 2001 and 1.6% in 2002, and the Fed was cutting interest rates. In other words, once the bubble burst and the economy slowed, lower inflation and lower rates did not help stock prices.
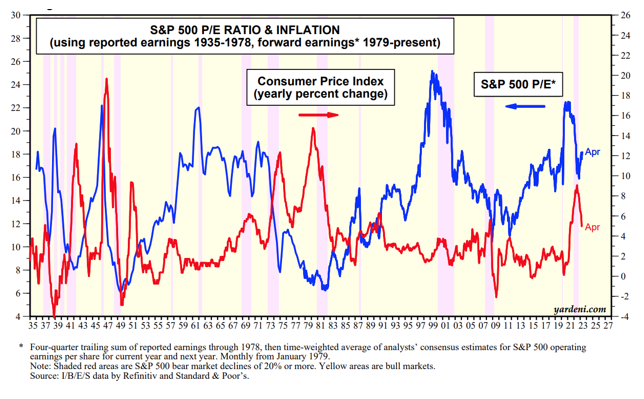
And here’s an interesting chart from Ed Yardeni showing S&P 500 PE multiples vs. CPI. As you can see, when CPI was at 5% (or even 4%), the S&P 500’s PE ratio was often 12x or lower:
Regarding sentiment, we can see from Ed Yardeni that in the Investors Intelligence poll the highest the “bear percentage” got so far in the current market was only around 45% (in the most recent poll it was just 23%!), yet there were multiple times during the 1980s, 1990s and 2008 that it climbed much higher:
Also, we can see from this old academic paper that during the grinding bear market of 1973 to 1975, when the S&P 500’s GAAP PE multiple dropped from 18x to 8x, the bears in the Investors Intelligence poll climbed to around 75% and went over 80% during the bear markets of the 1960s:
And CNN’s excellent “Fear & Greed Index” is once again firmly in the “greed” zone:
So if you think that based on this bear market’s sentiment we’ve “seen the bottom,” history would beg to differ.
Here then is some commentary on some of our additional positions [QTR: and an update on Tesla]; please note that we may add to or reduce them at any time…


