

By Jeffrey Tucker, Brownstone Institute
Many of us have had the intuition that the economic damage from 2020 – including industrial stoppages, monetary printing, supply-chain disruptions, extended school closures, and general population demoralization – was in fact far greater than official statistics indicate.
What follows will shore up this intuition, using new techniques and numbers from an innovative project called RealityIndex.co.
It’s true that official data is bad enough, showing a 26% loss in purchasing power, slow growth in output, and only marginal improvements in real income. The labor participation rate and worker/population ratio never fully recovered and continue to fall.
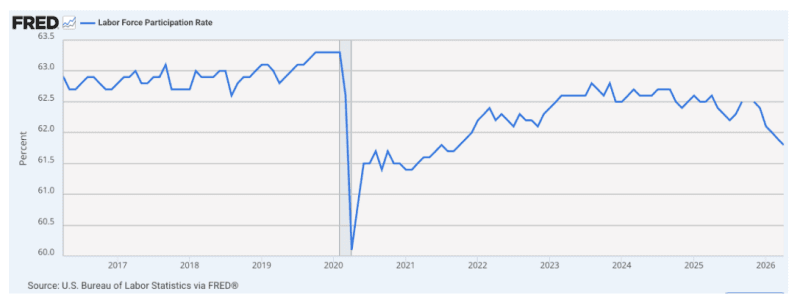
Output has been lackluster. It’s supposedly running 2.3% which is about half the postwar norm for US economic performance. It feels like a general downshift. Official data shows a brief recession in 2020 followed by gradual economic recovery overall.
But is this even true? In 2024, Brownstone Institute commissioned a study (by E.J. Antoni and Peter St. Onge) that concluded that we have never really entered recovery after 2022. We’ve been in a technical recession since that time. They got this with some limited adjustments of price data bumped up against output data. That study was met with brutal attacks, with every critic falling back on official data and doubting the supposed extremism of the conclusion.
That’s where matters have stood even as reports pour in concerning broken labor markets, no raises for 1 in 4 professional-class workers, and sketchy Gross Domestic Product (GDP) data that seems barely above zero thanks mainly to medical-sector subsidies, government spending, and social services. Then there are the learning losses showing dramatic declines in test scores among affected students.
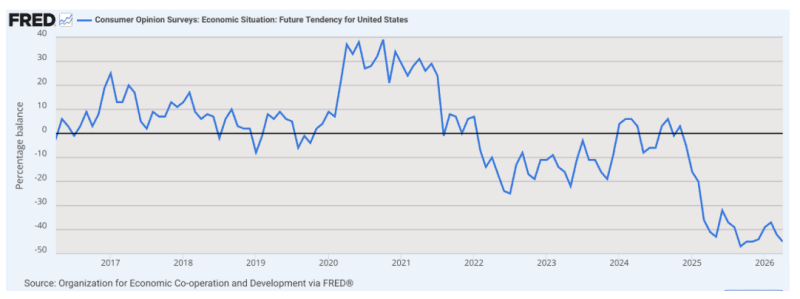
We are left with real questions. How can consumer sentiment be at historic lows given that the overall data seems to raise no loud alarms?
In the meantime, Artificial Intelligence has come along to make these complicated calculations possible, ones that seek to discern and delineate the huge gaps between official data and reality. The goal is to come up with real data concerning real prices, sans the many different methods that the Department of Labor uses to adjust price changes.
For example, housing prices are not measured directly but rather converted to owners’ equivalent rent (OER). Medical service prices are adjusted for consumption, not premiums or final bills. When consumers substitute one good for another, that is also factored in. When the quality of a good or service improves, the statisticians apply what they called hedonic adjustments, which are invariably designed to minimize price increases and never run the other direction.
Where does this leave those of us who are looking for a plain index of prices? A veil has been put over that basic question and answer, such that we don’t know for sure. This matters tremendously for issues like raises, examining cost of living increases, taxes, and pension payments. Everything is adjusted for inflation to convert it to real valuations but if we don’t have a clear number, what are we to do?
This is why we should be thrilled about a new study/service called the Reality Index. You are free to browse the site yourself and examine every aspect of the method. Essentially, the site owner, an independent intellectual in Madrid, Tom Elliott, has deployed tools of AI to wholly reconstruct price indices in a way that is consistent with actual prices. His results are absolutely eye-popping. I’ve examined the method here in detail and found no fault.
The Wall Street Journal has also taken notice. This is good news and raises the possibility that we can finally get to the truth.
The core of the problem is a constantly changing methodology in official data. The formula was changed eight times over 35 years. All the changes seem technical and vaguely justifiable, once explained. Adding them all up, you get wild distortions in the data that the index is supposed to reveal. All these changes came home to roost in the great inflation of 2021-2024, which might be entering a second wave right now.
In 1983, owners’ equivalent rent replaced basic housing prices. The new formula was based on an estimate of what homeowners would have to pay to rent their own homes. But in real life, people pay mortgages, property taxes, and home prices. When home prices and mortgage rates rise faster than rents, the new formula understates the housing inflation real households face.
In 1996, the Boskin Commission announced that the Consumer Price Index (CPI) was overstated because people substitute higher-priced goods for lower-priced goods which are too slow in being calculated. The agency made the correction to eliminate the bias in the fixed basket of goods. The problem is that every single adjustment ended up forcing the reported rate to be less than a plain addition of the same goods over time.
In 1998, there was a new fashion for hedonic adjustments. This stemmed from an observation that quality is always improving, especially in digital goods and computer functioning. The idea is that you might be paying the same or even more but you are getting more bang for your buck with quality shifts. You guessed it: hedonic adjustments drew the inflation rate lower. Notably, hedonic adjustments never run the other way, raising prices when quality decreases.
In 1999, a geometric mean formula replaced arithmetic mean for most CPI components. This was intended to capture substitution effects. This was the change that ended up disguising the increase in medical service costs. By looking at consumed services rather than actual prices, the inflation rate in this sector ended up burying inflationary trends. This highly technical adjustment completely ignored all the ways in which substitution is a behavioral adaptation to inflation, not a reduction in the inflation experienced.
In 2002, we got a continuation of this same method with new “chained CPI” which changes the basket weighting based on new purchasing patterns. Sure, if people buy less beef and more chicken, the household will experience inflation in a different way. But this ignores the manner in which the substitutions themselves are a response to higher prices. In 2017, the new calculation was applied to taxes causing people to pay more than they otherwise would have under the old method.
In 2018, the hedonic adjustment strategy was expanded to a huge new range of products including smartphones, residential telephone services, internet services, and cable and satellite television. In 2020, at the same time the composition of M1 was changed and not retrospectively applied such that the data is essentially useless. Following money supply data became more difficult. Then in 2024, the Bureau of Labor Statistics stopped looking at the actual cost of medical services and started only looking at claims, completing the consumption-only bias against actual posted prices. In 2025, a month went by with no data collection at all.
So what happens when we strip all this away and examine actual prices as reported by the Bureau of Labor Statistics, without all the many adjustments? We find that a basket of goods and services that cost $100 in 1980 costs $515 per the Reality Index in 2025. The official CPI reports only $391.
That means that real prices have run 32% higher over 45 years than the government reports. Over a 55-year window, the Reality Index ran 54.4% faster than CPI.
To put it another way, consider the loss of purchasing power since 1980. According to the CPI, the loss has been to make $1 in 1980 worth only 26 cents. According to the Reality Index, the loss is greater: $1 in 1980 is now worth only 19 cents. By any standard, that is a shocking devaluation. All of this became much worse starting with lockdowns.
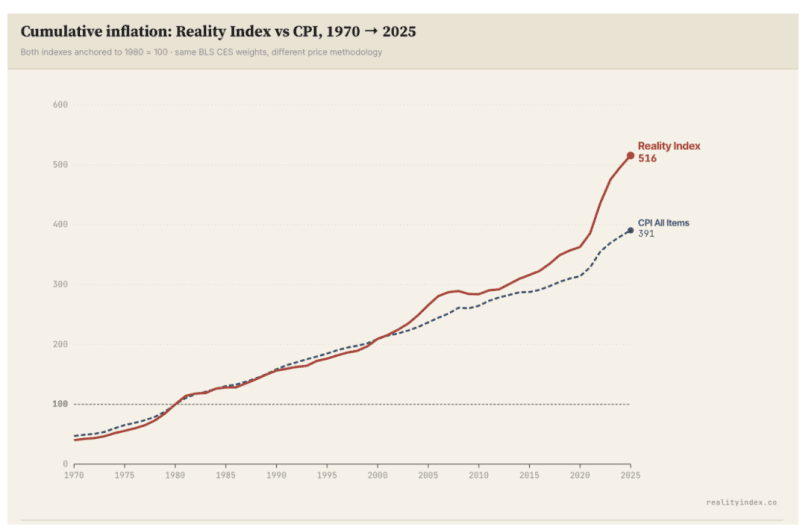
There is much more work to do with this method. The charts could be interactive. They can also be set for real-time updates. They will be if Elliott continues to develop this. He should. There might even be commercial value in this.
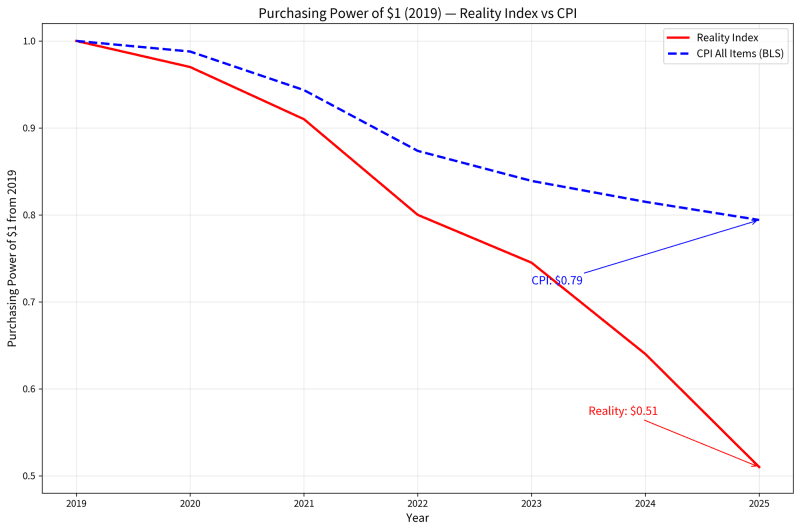
Think about the implications. Isolating from the beginning of the Covid period to the present, Elliott’s data estimates as much as a 40% loss in purchasing power over six years. Or perhaps closer to 50%. Here is a zoom in of the above chart covering 2019 to the present.
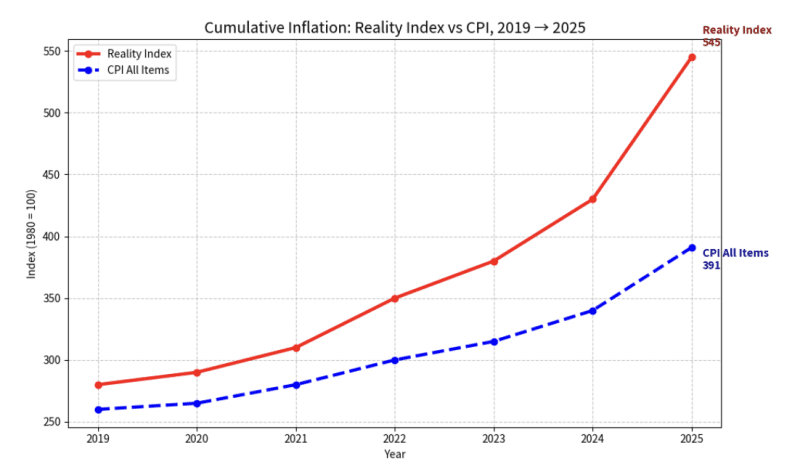
This seems correct to me. Government data, meanwhile, logs only a 26% loss. That’s a massive gap between the official data and what prices actually reveal. With an AI re-rendering that tracks purchasing power – the flipside of the increase of prices – we get numbers closer to 50%. That means that Covid cut the value of the dollar in terms of goods and services to half its former value.
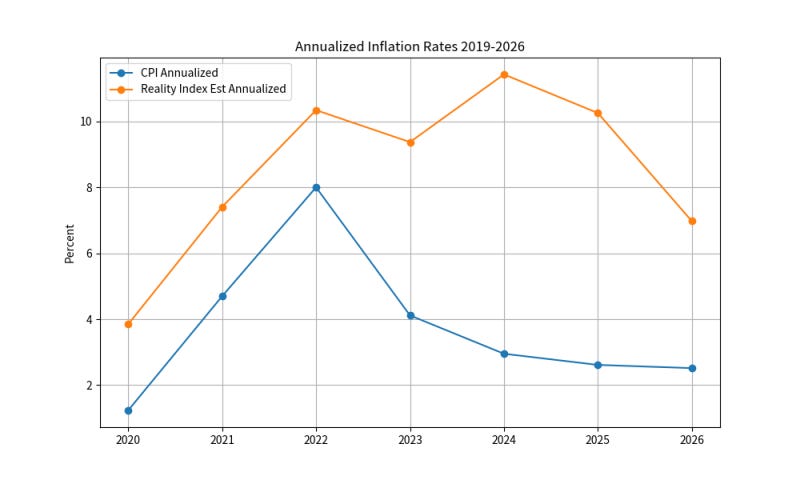
I asked AI to map this out in terms of year-over-year changes in prices. CPI shows a peak in 2022 followed by a decline in the rate of increase. Reality Index shows that the devaluation actually intensified and never fell below 6%. This explains so much about consumer sentiment and political shifts. People feel it even if official data never revealed it. This kind of chart forces a rethinking of the history of the last six years.
There are still larger implications. We measure national output with the Gross Domestic Product, a national income statistic used since the 1930s. For output data, it would make no sense to report it in nominal terms without factoring in inflation. As a result, the GDP is usually reported in real terms, with an inflation adjustment that is continually compounded on an annual basis.
Elliott’s own data – which is shocking enough – did not go into the implications for GDP. But I was able to use a simple AI tool to make those adjustments, adding the corrected price index as the deflator metric.
The result is rather astounding. The recession of 2020 never really ended in a sustained way. Charted by hard numbers and then by percent change, you gain a very different picture of present levels of output. It causes one to completely rethink the last six years.
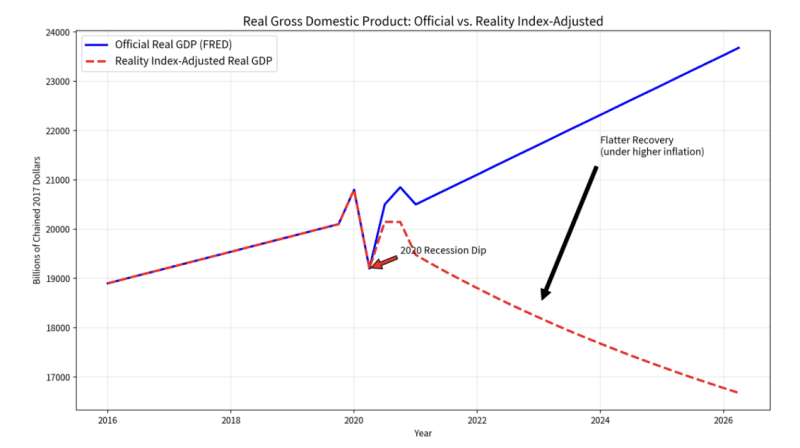
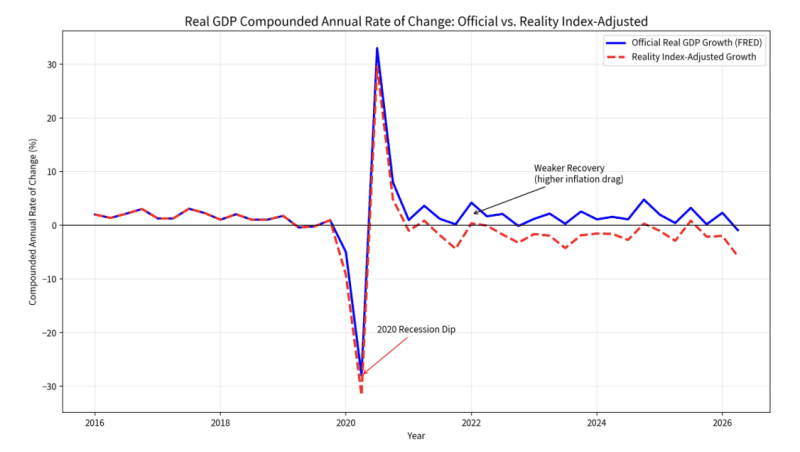
The official definition of recession is two quarters of declining real GDP. In revised data, we’ve had consistently negative GDP in all but three quarters since summer of 2022. In those three quarters, output barely rose above zero. Mostly real GDP has been falling, a recession without end.
Overall, Grok AI estimates a loss of 5-12% of GDP from 2019 to present using Reality Index numbers. Sorry but read that again. Instead of any recovery, we’ve seen as much as double-digit declines in GDP overall since 2020. This is the cumulative loss spread out over six years.
That’s roughly half of the losses of the full period of the Great Depression, which was more catastrophic than people know. Most research from the 1930s, for example by George Selgin, shows that this was not a normal business cycle but a structural hit tracing to the very coercive measures designed to fix the problem. Price controls and market disruptions made a bad situation far worse. This is precisely the sort of hit that should worry us the most.
The lockdowns were a similar situation: a massive exogenous shock to commerce, accompanied by a huge devaluation of the currency. It amounted to a gigantic transfer of wealth to elites, the largest in history, followed by a destruction of wealth of the middle and lower classes.
At least during the Great Depression, people knew it was happening. It was officially documented. Our times are different. We have heard nothing for six years except happy talk about economic recovery. Based on real data, the opposite has happened, most tracing to the disastrous lockdowns of 2020.
The beauty of this data is that it is subject to replication. Anyone can look at the methodology and disagree. Be my guest. From what I can see, the actual picture is far closer to the reality that most people are experiencing.
In other words, that only one in four workers has had a nominal raise in five years barely scratches the surface. The reality could be that we’ve lost as much as 12% of national output since the lockdown era, along with a halving of the currency value. It’s somehow worse that we are only now able to document this.
Also, I would like to see his methods applied to my own concern over effective household income per hour of work. We keep hearing that household income is rising in real terms without considering that it generally takes two incomes to provide what one once did. It won’t do to pretend that two incomes in a single household is double the income when one person has been drafted into the workforce to sustain living standards.
Adding that consideration in here, and the dramatic change in household remuneration between 1950 and 1990, would be very revealing. After all, only 1 in 5 households (with children under 18) had two income streams in 1950 where it is 3 in 5 today. That is effectively a diminution of wages per household hour and not an increase in income. Add that consideration and you would generate a chart of declining living standards in the decades before lockdowns delivered the final coup de grâce.
And that is where we are today. Households are scrambling to keep the bills paid while juggling children and domestic life while running from job to job to keep the flow going as best they can. Meanwhile, they money they earn has less buying power than ever. It’s no wonder consumer sentiment is rock bottom.
It is long past time for this technical work to be done. What Tom Elliott has provided is what index numbers should provide: clean and stable comparisons of the same or similar products over time, no adjustments, refinements, and manipulations. Run those numbers against conventional output numbers and you produce a very different picture of economic performance since 2020.
We’ve lived so long with distorted statistics. It fascinates me that the person who finally did it is an independent data expert in Spain rather than an employed academic in the US. That itself is revealing.
The big picture is that the lockdowns, not only nationally but globally, were far more catastrophic for us economically than has been generally admitted or recognized. It is not unusual in the history of economics for the really bad news to emerge years and even decades after an exogenous shock such as war.
We would rather not wait that long. The crisis is too real and the public knows, even if the official data does not admit the truth.
Lockdowns were a kind of war on the population. The economic carnage might have sliced off half of the purchasing power of the dollar and cut output by as much as 12% over six years (in real terms, leaving aside missed counterfactual growth on the previous trajectory), even as labor participation never recovered and continues to fall.
Did Covid kick off a kind of permanent recession? How many decades must pass before we admit what happened? More precisely, how much longer will it take before the public mind recognizes what they did to us?

QTR’s Disclaimer: Please read my full legal disclaimer on my About page here. This post represents my opinions only. In addition, please understand I am an idiot and often get things wrong and lose money. I may own or transact in any names mentioned in this piece at any time without warning. Contributor posts and aggregated posts have been hand selected by me, have not been fact checked and are the opinions of their authors. They are either submitted to QTR by their author, reprinted under a Creative Commons license with my best effort to uphold what the license asks, or with the permission of the author.
This is not a recommendation to buy or sell any stocks or securities, just my opinions. I often lose money on positions I trade/invest in. I may add any name mentioned in this article and sell any name mentioned in this piece at any time, without further warning. None of this is a solicitation to buy or sell securities. I may or may not own names I write about and are watching. Sometimes I’m bullish without owning things, sometimes I’m bearish and do own things. Just assume my positions could be exactly the opposite of what you think they are just in case. If I’m long I could quickly be short and vice versa. I won’t update my positions.
As of May 20, 2026 I personally no longer actively trade (read my story here). My investing/saving is done by recurring contributions mostly to sector ETFs and a few select equities, trusted third parties who oversee my accounts, and advisors. Such advisors or funds, through individual equities, options, index funds, mutual funds, ETFs, or other securities, may have positions in, exposure to, or holdings of names mentioned herein that I know nothing about. Basically, via index funds, ETFs and individual equities it is possible I could own, have exposure to, or not own anything at any point. As of the same date, May 20, 2026, in an attempt to lead a healthier lifestyle, I’ve also excluded myself from fantasy sports, sports betting, online and in-person casinos and prediction markets.
And all positions can change immediately as soon as I publish this, with or without notice and at any point I can be long, short or neutral on any position. You are on your own. Do not make decisions based on my blog. I exist on the fringe. If you see numbers and calculations of any sort, assume they are wrong and double check them. I failed Algebra in 8th grade and topped off my high school math accolades by getting a D- in remedial Calculus my senior year, before becoming an English major in college so I could bullshit my way through things easier.
The publisher does not guarantee the accuracy or completeness of the information provided in this page. These are not the opinions of any of my employers, partners, or associates. I did my best to be honest about my disclosures but can’t guarantee I am right; I write these posts after a couple beers sometimes. I edit after my posts are published because I’m impatient and lazy, so if you see a typo, check back in a half hour. Also, I just straight up get shit wrong a lot. I mention it twice because it’s that important.
Ya know the message the plandemic sent me ? Life's short , enjoy it , meditate more , focus on what you can change . If you are talking about admitting that the government needs changing , good luck because once again it comes down to getting "them" to stop printing money.
In truth , it's hard to be positive about anything in this country. Toxic chemicals that pass as food and glyphosate addicted vegetables producing a fat stupid sick population . Money that is becoming truly worthless. Piece of shit planned obsolescent overpriced products . Children being indoctrinated instead of educated . A government run by no term limit liars and controlled by AIPAC . What did I miss ? Oh yeah, big pharma and the media . In truth , we are so FAHAHAHAHAHUCKED . Thanks for letting me brighten your day .
Best bumper sticker I've ever seen . "Best Revenge , Pay Cash" .
Union Sundown
Bob Dylan
Well, my shoes, they come from Singapore
My flashlight's from Taiwan
My tablecloth's from Malaysia
My belt buckle's from the Amazon
You know, this shirt I wear comes from the Philippines
And the car I drive is a Chevrolet
It was put together down in Argentina
By a guy makin' 30 cents a day
Well, it's sundown on the union
And what's made in the USA
Sure was a good idea
'Til greed got in the way
Well, this silk dress is from Hong Kong
And the pearls are from Japan
Well, the dog collar's from India
And the flower pot's from Pakistan
All the furniture, it says "Made in Brazil"
Where a woman, she slaved for sure
Bringin' home 30 cents a day to a family of 12
You know, that's a lot of money to her
Well, it's sundown on the union
And what's made in the USA
Sure was a good idea
'Til greed got in the way, yeah
Well, you know, lots of people complainin' that there is no work
I say, "Why you say that for?"
When nothin' you got is US-made
They don't make nothin' here no more
You know, capitalism is above the law
It say, "It don't count 'less it sells"
When it costs too much to build it at home
You just build it cheaper someplace else
Well, it's sundown on the union
And what's made in the USA
Sure was a good idea
'Til greed got in the way
Well, the job that you used to have
They give it to somebody down in El Salvador
While the unions are big business, friend
And they're goin' out like a dinosaur
Well, they used to grow food in Kansas
Now they want to grow it on the moon and eat it raw
I can see the day coming when even your home garden
Is gonna be against the law
Well, it's sundown on the union
And what's made in the USA
Sure was a good idea
'Til greed got in the way
Democracy don't rule the world
You'd better get that in your head
This world is ruled by violence
But I guess that's better left unsaid
From Broadway to the Milky Way
That's a lot of territory, indeed
And a man's gonna do what he has to do
When he's got a hungry mouth to feed
Well, it's sundown on the union
And what's made in the USA
Sure was a good idea
'Til greed got in the way
Written by: Bob Dylan