Is Someone Attacking the Comex? January Sees $5.2B in Gold Deliveries
"In the 5+ years I have been tracking the Comex data, there has never been a month like this."
By Peter Schiff, Schiff Gold
The CME Comex is the Exchange where futures are traded for gold, silver, and other commodities. The CME also allows futures buyers to turn their contracts into physical metal through delivery. You can find more detail on the CME here (e.g., vault types, major/minor months, delivery explanation, historical data, etc.).
The data below looks at contract delivery where the ownership of physical metal changes hands within CME vaults. It also shows data that details the movement of metal in and out of CME vaults. It is very possible that if there is a run on the dollar, and a flight into gold, this is the data that will show early warning signs.
Gold
In the 5+ years I have been tracking the Comex data, there has never been a month like this. The analysis last month highlighted some of the wild activity that started in December. That activity has carried directly through into January.
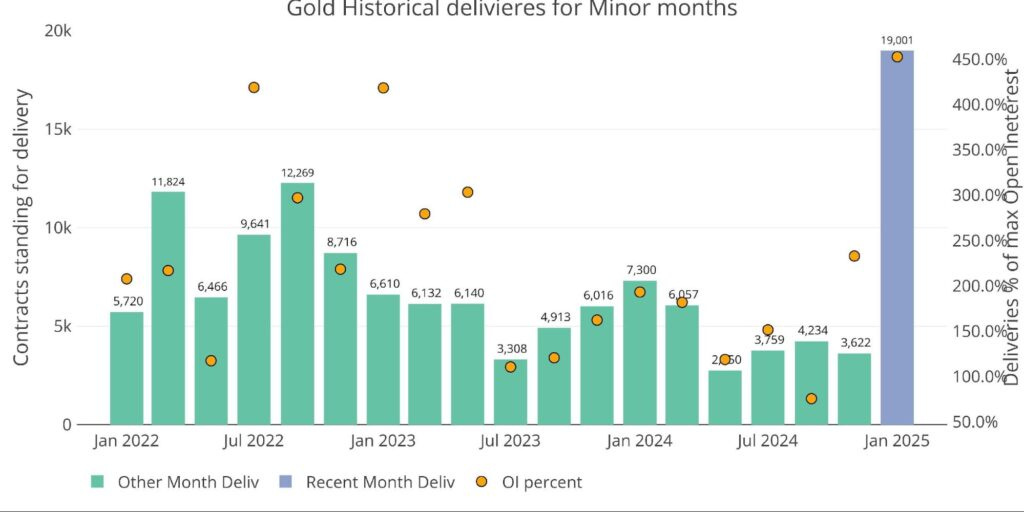
Let’s start with the delivery volume. January is minor month and does not typically see large demand. That changed this month with 19,001 contracts being delivered with 3 days still to go until February contracts start delivery. For context, that 19k volume (or $5.2B) would be about average for a major month, but minor months are typically less than 1/4 the major months.
Figure: 1 Recent like-month delivery volume
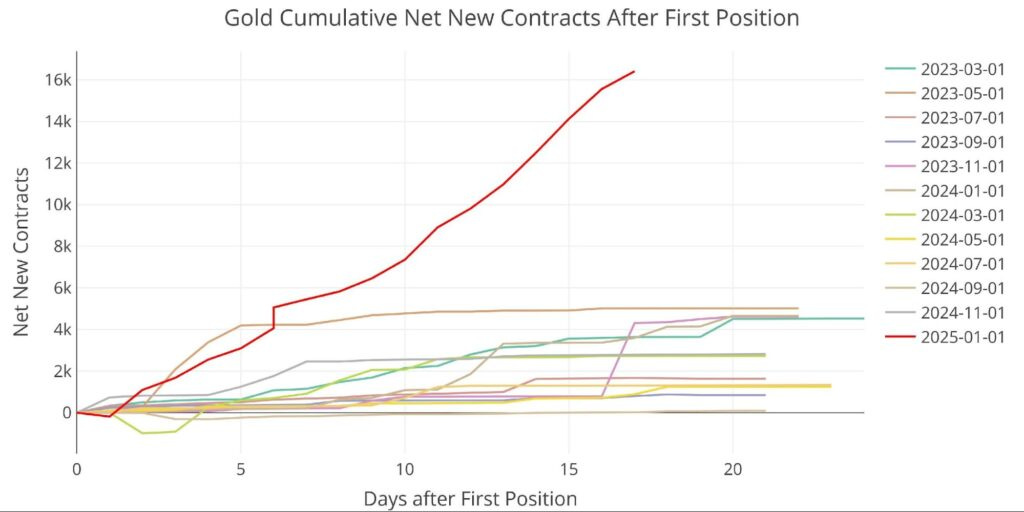
So, what drove this massive delivery volume? It was net new contracts coming in throughout the month. These are contracts that open and settle immediately with delivery. The chart below shows how much this deviates from past months. It was not any single day; it was just consistent buying throughout the month.
Another very odd aspect is the way the buying has occurred. Usually, net new contracts happen early in the contract and then dissipate as the next month approaches. With only three days to go, contracts are still being bought and delivered.
Figure: 2 Cumulative Net New Contracts
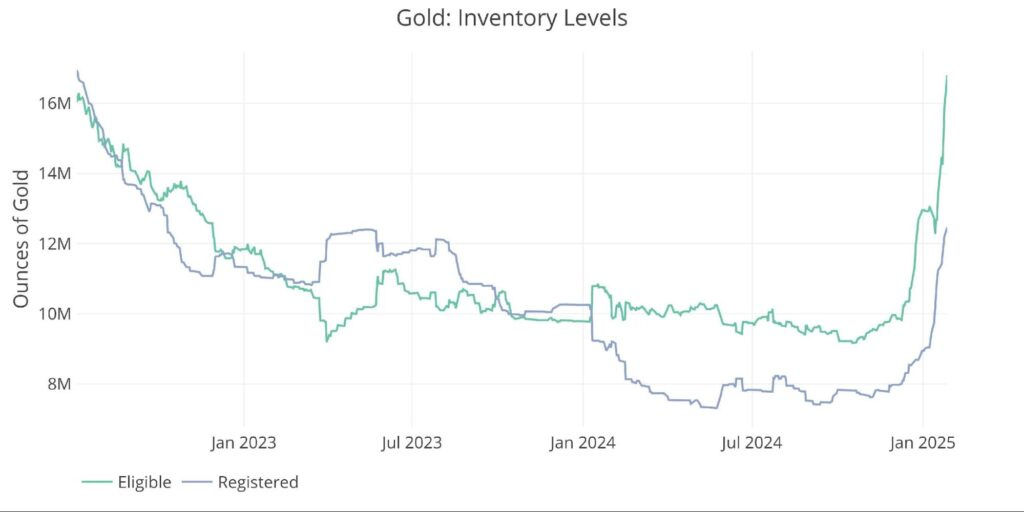
So how did the Comex respond to a delivery request of 1.9M ounces of gold being purchased for delivery? They restocked their supplies in a massive way. Since December 1st, the Comex inventory has surged by a whopping 11.5M ounces. This is 10x the amount that was just requested for delivery.
Furthermore, on December 1st, according to Comex reports, there were about 18M ounces of gold in the vaults. With plenty of coverage, why the sudden surge in inventories to meet demand? Is it possible that not all that metal is actually available for delivery? Has a big buyer made it known they will be buying more in the coming months?
The data should give more to the story in the coming months, but the initial indicators point to something major going on behind the scenes.
Figure: 3 Inventory Data
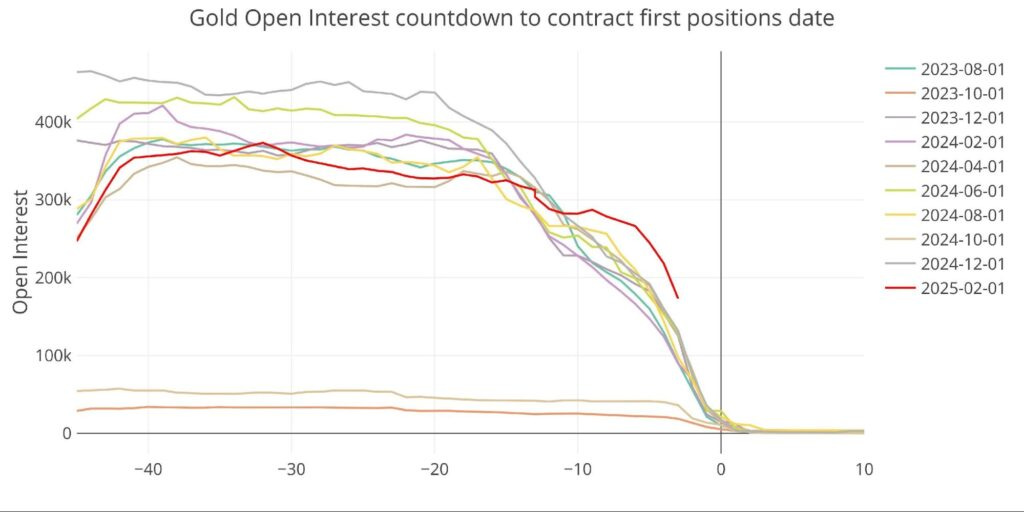
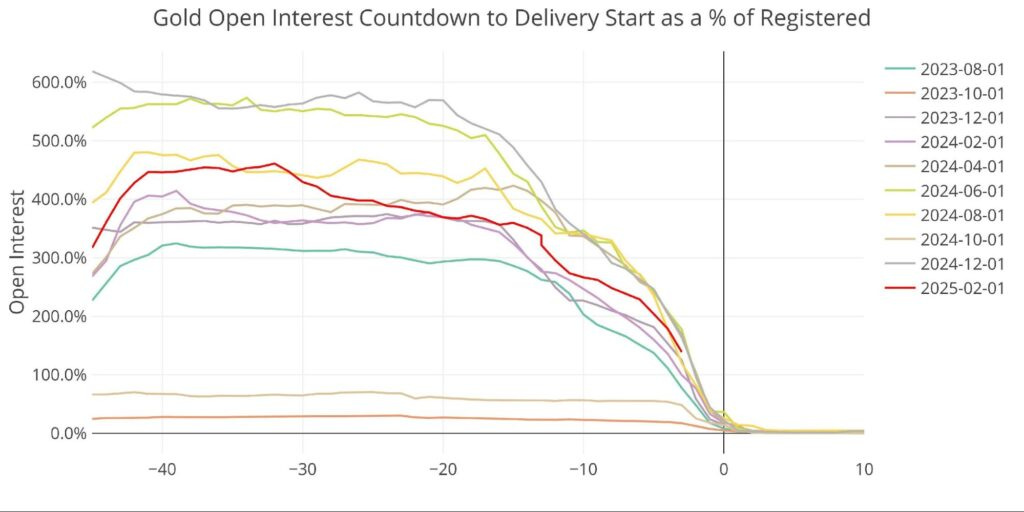
The oddities do not stop in January. February (a major month) is tracking well above average as shown in the chart below. This likely indicates that delivery volume is going to stay elevated.
Figure: 4 Open Interest Countdown
The massive surge in inventory was just enough to make the current open interest about average on a relative basis.
Figure: 5 Open Interest Countdown Percent
Silver
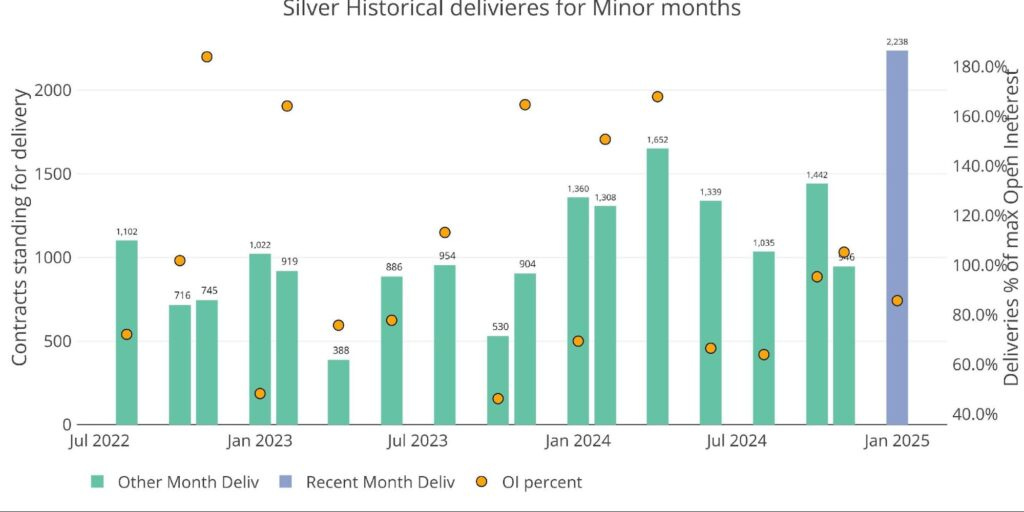
Silver also saw elevated activity but not nearly to the same degree. January just posted its best minor delivery month in at least 2.5 years, but it was not as outside the average range as gold.
Figure: 6 Recent like-month delivery volume
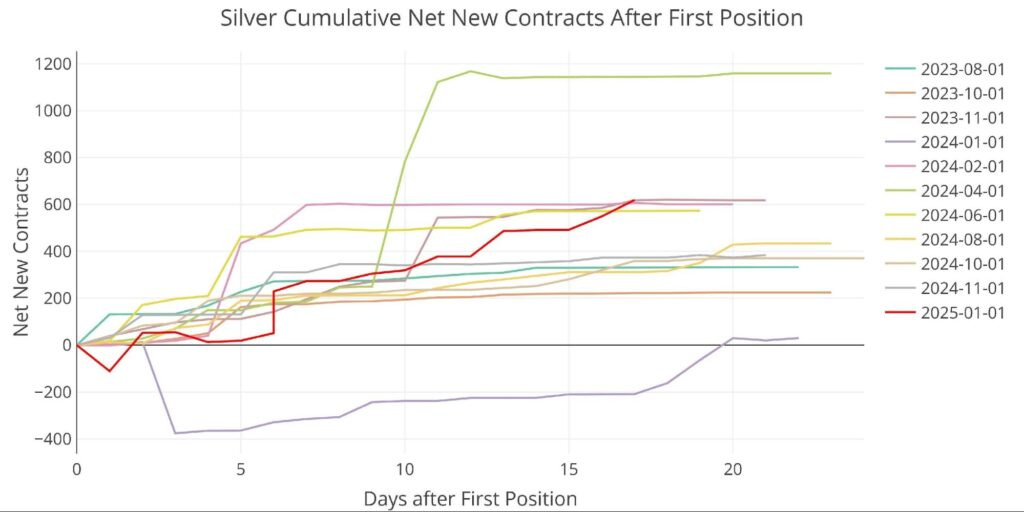
Net new contracts in silver were much more in line with history as well.
Figure: 7 Cumulative Net New Contracts
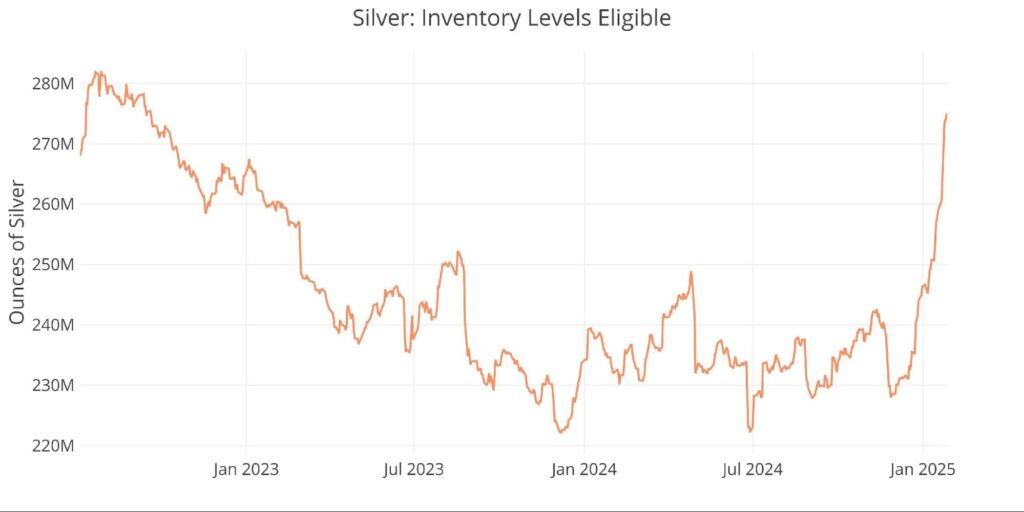
That said, the Comex has taken action to restock inventory levels (plotted separately). As the plot below shows, Eligible has seen a massive surge higher.
Figure: 8 Inventory Data
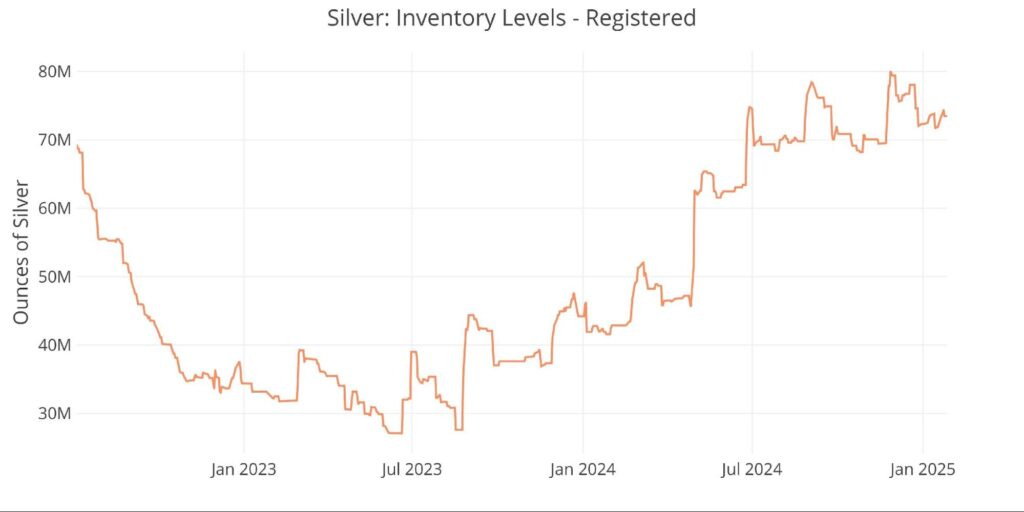
Registered silver is the only thing staying quiet during all of this.
Figure: 9 Inventory Data
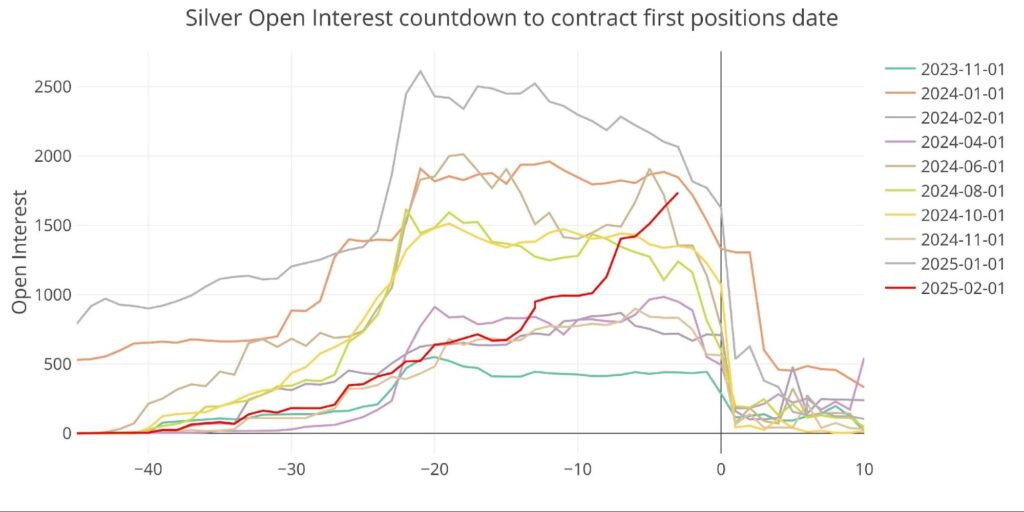
As we approach February, it is clear to see that demand is picking up into the close. This suggests that February could be another big month.
Figure: 10 Open Interest Countdown
On a relative basis, open interest is high but not as high because of the recent surges in inventory levels.
Figure: 11 Open Interest Countdown Percent
Conclusion
So, what’s going on?
It’s hard to know for sure, but it looks like a big buyer has entered and is doing things differently. $5.2B in delivery is fairly normal for a major month on the Comex. But this was not a major month and the way it happened was very abnormal (net new contracts). It does not look like the demand is slowing either.
This analysis has continuously highlighted that cracks are going to appear on the Comex first. It’s very possible we are starting to see the initial cracks that could apply a ton of pressure to the Comex. If the Comex runs into any trouble over the coming months making deliveries… it will send shockwaves through the precious metals market. This might be why they have restocked to such high levels. The question is … will it be enough?
QTR’s Disclaimer: Please read my full legal disclaimer on my About page here. This post represents my opinions only. In addition, please understand I am an idiot and often get things wrong and lose money. I may own or transact in any names mentioned in this piece at any time without warning. Contributor posts and aggregated posts have been hand selected by me, have not been fact checked and are the opinions of their authors. They are either submitted to QTR by their author, reprinted under a Creative Commons license with my best effort to uphold what the license asks, or with the permission of the author.
This is not a recommendation to buy or sell any stocks or securities, just my opinions. I often lose money on positions I trade/invest in. I may add any name mentioned in this article and sell any name mentioned in this piece at any time, without further warning. None of this is a solicitation to buy or sell securities. I may or may not own names I write about and are watching. Sometimes I’m bullish without owning things, sometimes I’m bearish and do own things. Just assume my positions could be exactly the opposite of what you think they are just in case. If I’m long I could quickly be short and vice versa. I won’t update my positions. All positions can change immediately as soon as I publish this, with or without notice and at any point I can be long, short or neutral on any position. You are on your own. Do not make decisions based on my blog. I exist on the fringe. The publisher does not guarantee the accuracy or completeness of the information provided in this page. These are not the opinions of any of my employers, partners, or associates. I did my best to be honest about my disclosures but can’t guarantee I am right; I write these posts after a couple beers sometimes. I edit after my posts are published because I’m impatient and lazy, so if you see a typo, check back in a half hour. Also, I just straight up get shit wrong a lot. I mention it twice because it’s that important.




Democrats buying gold with all their stolen funds to crash and burn everthing
Proof... sanctions blowback is a bitch
I've been reading that both Japan and China, two of the largest holders of US Treasuries, are selling off major portions of their portfolios. The Japanese are doing it to raise money to intervene in the currency markets to support the falling yen.
China is doing it to flood an already saturated Treasuries market, making it harder for the US Treasury to refinance our debt and thus, driving interest rates higher. Additionally, the Chinese are using the proceeds to buy gold, a form of economic proxy war against the US dollar. Maybe China is the big buyer referred to in the article.