Fed’s Asset Purchases Result in Increased Market Volatility
"Once again, the empirical evidence supports reigning in the Fed; the economy works better when the Fed does less, not more."
The Federal Reserve underwent a massive regime shift following the 2008 financial crisis. It incorporated several new tools into its monetary policy arsenal, ranging from interest on excess reserves to large‐scale asset purchases (“quantitative easing”) to deal with the crisis. Unfortunately, as with most public institutions, power given is seldom relinquished.
As a recent Cato CMFA article noted, if the Fed is expected to massively increase its balance sheet in response to every major crisis, it will never return to a pre‐2008 operating system. Furthermore, the COVID-19 pandemic spurred a further round of massive quantitative easing, so much so that instead of shrinking back down, the Fed’s asset holdings are now over one‐third the size of the entire US commercial banking sector.
It stands to reason that such a massive shift in central banking should have effects on the financial system. A recent Wall Street Journal opinion piece makes this argument and uses options market data to suggest that the Fed’s involvement in financial markets has increased stock market volatility.
To be fair, the article points out a singular observation, one which may not reflect any underlying trend.
But there are ways to check for any underlying trend, such as vector autoregressions (VARs). In this post, I use a VAR method and demonstrate that the Fed’s 2008 regime shift has indeed had serious repercussions for market volatility as measured with the CBOE Volatility Index (“VIX”). (For those interested, I provide more details on the methodology after discussing the results.)
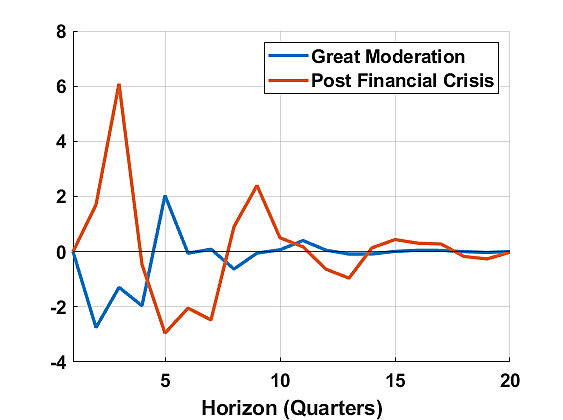
Figure 1 shows the response of the VIX to an unexpected one‐percent increase in Fed asset holdings. It is immediately clear that the relationship between the Fed’s balance sheet and volatility has flipped since 2008. Prior to the financial crisis (the blue line in Figure 1), when the Fed purchased more assets, market volatility slightly declined. A 1 percent increase in asset holdings reduced volatility by around 2 percent at peak efficacy. After the crisis (the red line in Figure 1), under the Fed’s quantitative easing framework, an increase in asset holdings significantly increased short‐term market volatility. In this period, a 1 percent increase in assets led to a 6 percent increase in volatility at peak efficacy.
And there’s more.
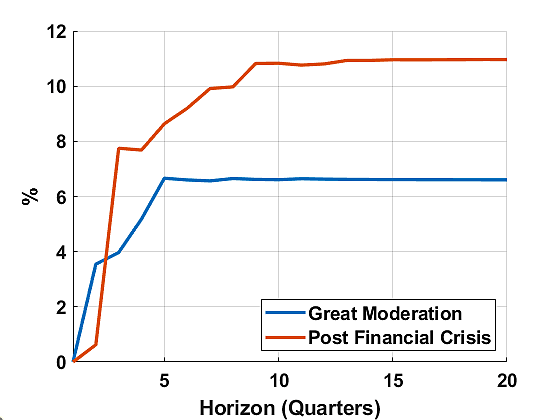
Figure 2 shows that the amount of market volatility that is attributable to Fed balance sheet shocks increased after the 2008 regime shift. Put simply, the percentage of all fluctuations in market volatility that is attributable to the Fed has increased. Prior to the financial crisis, the Fed accounted for around 6 percent of the fluctuations in the VIX. Following the crisis, it has accounted for well over 10 percent of the movements in the VIX. So, along with increasing the severity of market volatility fluctuations, the Fed has also become more responsible for overall market volatility post‐2008.
Though it is not shown in Figure 2, the portion of volatility now attributable to the Fed is similar to the degree by which overall demand and supply factors influence the VIX. That is, the Fed’s actions are now roughly as important in driving volatility as overall economic conditions.
There may be several possible explanations for this flip in the transmission of the Fed’s asset purchases to volatility under the new framework. Before the crisis, asset purchases were not in themselves considered a means of easing or tightening. Market participants may now view Fed asset changes as a signal of weakening economic conditions due to the scale and frequency of quantitative easing measures. Conversely, before 2008, balance sheet expansions were less common and typically viewed as a routine adjustment or a response to relatively minor financial disruptions. The nature of the assets being purchased also changed post‐2008, when the Fed, for the first time, expanded its asset purchases to include a large quantity of mortgage‐backed securities. And, of course, in response to COVID-19, the Fed also began purchasing corporate bonds and ETFs.
Once again, the empirical evidence supports reigning in the Fed; the economy works better when the Fed does less, not more.
For those interested, here is a brief description of the VAR method used for this post. A vector autoregression with four lags is fitted to quarterly data on four variables—output gap (i.e., how far US real GDP is away from its potential capacity), inflation computed using the GDP deflator, percentage change in the VIX, and percentage change in the Fed’s total asset holdings.[1] The VIX uses stock index option prices to measure the market’s expectation of short‐term volatility. Since the goal of this post is to compare the Fed’s effect on volatility under its post‐2008 operating framework, the VAR is estimated over two data samples—1991 through 2007 (“Great Moderation”) and 2009 through 2019 (“Post Financial Crisis”). The start year is set at 1991 to match the first full year when VIX data are available. The full year of 2008 is skipped to ignore the transition between the Fed’s pre‐crisis and post‐crisis operating framework.
The Fed’s framework has arguably changed again following the COVID-19 pandemic but there has been insufficient data since then to estimate any meaningful statistical model. Moreover, the Fed is still operating in an abundant reserve framework, and paying interest on reserves, both of which are the major defining characteristics of the new operating regime.
This VAR method offers important advantages when trying to empirically describe the relationship between the Fed’s balance sheet and volatility. Firstly, it includes macro indicators (output gap and inflation) so that any common changes in volatility or asset holdings resulting from responses to general economic conditions are not mistakenly attributed to each other. Secondly, such a method prevents obfuscation created through the cross‐dependence of volatility and assets on each other. That is, it will not incorrectly attribute the effects of volatility on balance sheet size in the other direction.
The author thanks Jerome Famularo and Nicholas Thielman for their invaluable research assistance in the preparation of this essay.
[1] All data is collected from the FRED database. Compiled Fed balance sheet data is only available directly from the Fed from late 2002. Bao et. al. (2018) extend this dataset all the way back to the Fed’s inception. Their dataset is used from 1991 until the start of the Fed’s own data series.
QTR’s Disclaimer: Please read my full legal disclaimer on my About page here. In addition, please understand I am an idiot and often get things wrong and lose money. I may own or transact in any names mentioned in this piece at any time without warning. Contributor posts and aggregated posts have been hand selected by me, have not been fact checked and are the opinions of their authors. They are either submitted to QTR by their author, reprinted under a Creative Commons license with my best effort to uphold what the license asks, or with the permission of the author. This is not a recommendation to buy or sell any stocks or securities, just my opinions. I often lose money on positions I trade/invest in. I may add any name mentioned in this article and sell any name mentioned in this piece at any time, without further warning. None of this is a solicitation to buy or sell securities. These positions can change immediately as soon as I publish this, with or without notice. You are on your own. Do not make decisions based on my blog. I exist on the fringe. The publisher does not guarantee the accuracy or completeness of the information provided in this page. These are not the opinions of any of my employers, partners, or associates. I did my best to be honest about my disclosures but can’t guarantee I am right; I write these posts after a couple beers sometimes. Also, I just straight up get shit wrong a lot. I mention it twice because it’s that important.


The economy runs best when the private sector runs it completely. The Federal Reserve is a marxist institution designed to milk the middle class dry, enrich the upper class and greatly expand the lower class. Period.
The Fed is a price maker in this market like commodity trading desks for big banks have been price makers for precious metals, naked shorting paper trades without the metal assets to back up their shorts. It requires no understanding of finance that at some point, price makers become price takers when they lose control. No amount of manipulation can stop a falling market (stocks) or rising price of precious metals (silver and gold). It's happening right now in metals, and it will soon happen in the stock market when no amount of dollar intervention will rescue a slide. Very few Americans understand the pain that's coming when their retirement accounts, bank accounts, and salaries slide by 80% in "real money" terms because the dollar becomes increasingly worthless. The time of the crash is being postponed because we are "the world reserve currency" and nations trade in dollars. Not for much longer. It will be EAST (Russia and China) vs WEST (USA and EUROPE), and sadly, the communists, statists, and dictators of China and Russia seem to have a better grasp of basic economics than the so-called "democratic" statists of the WEST. Once the USA loses reserve status, like England lost the Sterling as the world's reserve currency in 1944, watch out. This comment isn't "the sky is falling." This comment is a plea "to get some politicians who understand basic economics."