

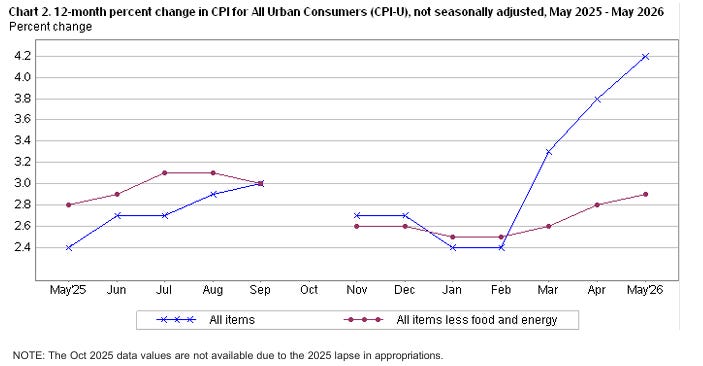
Inflation’s embers flared again in May, dashing hopes that last year’s price scare was fading. The Consumer Price Index for All Urban Consumers (CPI-U) rose 0.5 percent for the month, lifting the headline rate to 4.2 percent year-over-year and marking a second straight acceleration. Energy was the chief culprit, and the renewed heat pushed safe-haven demand for precious metals higher, with spot gold briefly touching $4,177 per ounce on Wednesday.
Source: BLS
Energy prices leapt 3.9 percent in May and now sit 23.5 percent above year-earlier levels. Gasoline alone surged 7.0 percent for the month and a staggering 40.5 percent over 12 months. According to the Bureau of Labor Statistics, energy costs accounted for more than 60 percent of May’s overall CPI increase. Wage earners felt the bite even more acutely; the CPI-W, the measure that determines annual Social Security cost-of-living adjustments, climbed 4.4 percent from a year ago. Even the Chained CPI, designed to capture substitution toward cheaper goods, jumped 0.6 percent in May and 4.0 percent on the year. This is hardly evidence that consumers can easily dodge higher prices.
Core inflation, which excludes the volatile food and energy categories, looked calmer at first glance, rising 0.2 percent in May and 2.9 percent year-over-year. Yet the details tell a stickier story. Shelter costs, the biggest component in the index, advanced 0.3 percent for the month and remain 3.4 percent higher than last spring despite a softening rental market. Food prices inched up 0.2 percent, leaving supermarkets 3.1 percent more expensive than a year earlier, while airline fares soared 2.7 percent in May and an eye-watering 26.7 percent over 12 months. Even modest upticks such as used-vehicle prices (up 0.1 percent on the month) suggest broad-based pressure rather than an isolated energy spike.
With real yields sinking back into negative territory, investors appear unwilling to wait for policymakers to tame the price spiral. Gold’s $94 intraday trading range on Wednesday underscores how quickly capital is searching for refuge outside the dollar. Critics of easy money note that core inflation may be below headline numbers, but at nearly 3 percent it still runs well above the Federal Reserve’s oft-cited 2 percent target.
The next CPI report, covering June, is slated for release on July 14th. Until then, consumers and markets alike are coping with an unpleasant mix of stubborn core prices, volatile energy, and an ever-more-attractive yellow metal. If May’s pattern holds, claims that inflation is “cooling” may feel as distant as the days of sub-$2 gasoline.
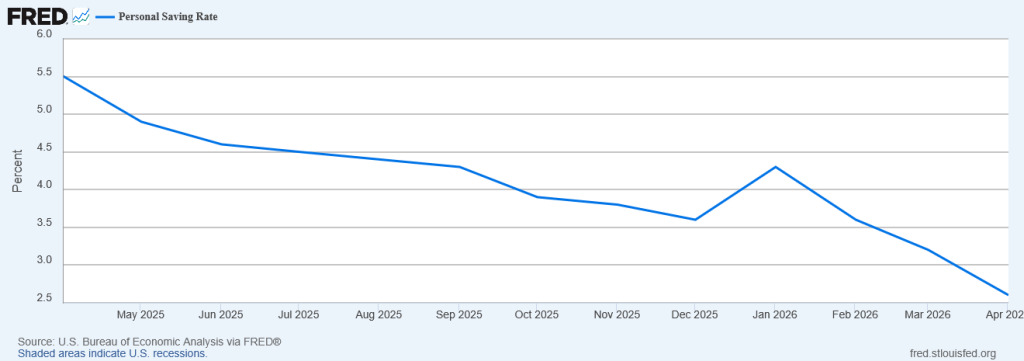
Meanwhile American households are plummeting to razor-thin financial margins as the personal savings rate falls to numbers last seen before COVID.
Personal savings fell from around 4.3% of disposable income in January to just over 2.5% in April, all as the cost of living continues to climb. Americans are drawing down reserves to cover groceries, housing, transportation, and insurance, with nothing left over for unexpected expenses (much less investing).
With savings accounts in a sharp decline, there isn’t much room to go lower.
US Personal Saving Rate, 1-Year
Source: U.S. Bureau of Economic Analysis, Personal Saving Rate [PSAVERT], retrieved from FRED, Federal Reserve Bank of St. Louis; https://fred.stlouisfed.org/series/PSAVERT, June 8, 2026.
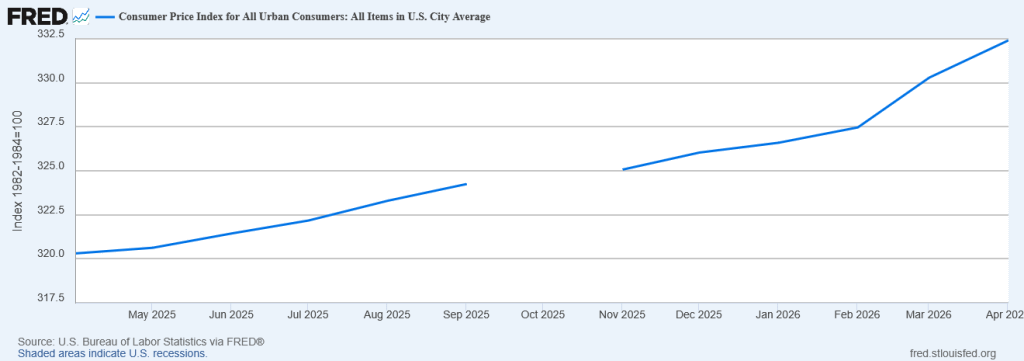
Wage growth hovers around 3.4%, yet recent inflation readings sit at around 3.8% (if you believe the understated official inflation data). Those inflation numbers will only get higher, squeezing real purchasing power to an unsustainable brink.
Consumer Price Index for All Urban Consumers: All Items in US City Average
Source: U.S. Bureau of Labor Statistics, Consumer Price Index for All Urban Consumers: All Items in U.S. City Average [CPIAUCSL], retrieved from FRED, Federal Reserve Bank of St. Louis; https://fred.stlouisfed.org/series/CPIAUCSL, June 8, 2026.
Meanwhile, people are taking out more loans on their 401(k) accounts and becoming delinquent on credit card and auto debt. With consumer spending propping up US GDP, rising prices across the board have forced a change to the traditional emergency fund guidelines, which say to maintain three to six month’s living expenses.
The goalposts have been reset. Even for the bare minimum of three to six months of expenses forming still the baseline for a viable emergency fund, the new view is that Americans require $20,000 or more in liquid savings to fulfill that requirement.
Asset owners may see gains in equities and real estate, but wage earners and those relying on fixed incomes experience steady erosion of their financial position. Peter Schiff has warned for some time that stagflation is here, and the writing is on the wall that it will eventually intensify into a full-blown crisis.
If you think gold, silver, oil, and Treasury yields are high now, they all look like they’re about to explode much higher. The same is true for consumer prices in general, as inflation returns with a vengeance. This does not portend 1970s stagflation. It portends something worse.
Recent data aligns with that view. Consumer sentiment has hit record lows while inflation reaccelerates. Downward revisions in GDP and jobs data are almost guaranteed to follow once the market digests the initial, rosier numbers.
Structural issues abound: massive government deficits, monetary accommodation, major wars, and supply pressures. In our stagflation, like many others throughout history, official figures mask the extent of the weakness in Main Street while wages sputter and prices for essentials keep climbing.
With inflation and recession conspiring to force a policy response, the Federal Reserve and other interventionary institutions can only prevent a recession today by guaranteeing an even bigger one later.
Other countries aren’t buying and holding US debt like they used to. A crisis is unavoidable the moment big buyers of US debt decide that it’s no longer worth the risk to put “full faith and credit” in America’s ability to make good on her promises.
Higher energy costs feed into price increases for practically everything else. Rents, food, utilities, construction costs, and insurance premiums are all going up. Even as some sectors post strong corporate profits, especially those tied to manic AI enthusiasm, the broader picture shows households struggling for the basics.
Confidence is fading as savings dwindle and savers are constantly being punished. Cash and low-yield deposits will lose ground while debt servicing costs remain elevated, with high credit card rates contributing to a cycle where people spend what they have just to maintain their current standard of living.
Expansionary monetary policy lowers the purchasing power of every dollar, but official CPI readings don’t show what real Americans are experiencing at the household level when it comes to feeding their kids, heating their homes, and saving for a future that actually feels hopeful.
Unlike central banks, you can’t print money, but you can protect yourself with gold when the Fed’s printing keeps pushing us toward the inevitable conclusion of their own experiments.

QTR’s Disclaimer: Please read my full legal disclaimer on my About page here. This post represents my opinions only. In addition, please understand I am an idiot and often get things wrong and lose money. I may own or transact in any names mentioned in this piece at any time without warning. Contributor posts and aggregated posts have been hand selected by me, have not been fact checked and are the opinions of their authors. They are either submitted to QTR by their author, reprinted under a Creative Commons license with my best effort to uphold what the license asks, or with the permission of the author.
This is not a recommendation to buy or sell any stocks or securities, just my opinions. I often lose money on positions I trade/invest in. I may add any name mentioned in this article and sell any name mentioned in this piece at any time, without further warning. None of this is a solicitation to buy or sell securities. I may or may not own names I write about and are watching. Sometimes I’m bullish without owning things, sometimes I’m bearish and do own things. Just assume my positions could be exactly the opposite of what you think they are just in case. If I’m long I could quickly be short and vice versa. I won’t update my positions.
As of May 20, 2026 I personally no longer actively trade (read my story here). My investing/saving is done by recurring contributions mostly to sector ETFs and a few select equities, trusted third parties who oversee my accounts, and advisors. Such advisors or funds, through individual equities, options, index funds, mutual funds, ETFs, or other securities, may have positions in, exposure to, or holdings of names mentioned herein that I know nothing about. Basically, via index funds, ETFs and individual equities it is possible I could own, have exposure to, or not own anything at any point. As of the same date, May 20, 2026, in an attempt to lead a healthier lifestyle, I’ve also excluded myself from fantasy sports, sports betting, online and in-person casinos and prediction markets.
And all positions can change immediately as soon as I publish this, with or without notice and at any point I can be long, short or neutral on any position. You are on your own. Do not make decisions based on my blog. I exist on the fringe. If you see numbers and calculations of any sort, assume they are wrong and double check them. I failed Algebra in 8th grade and topped off my high school math accolades by getting a D- in remedial Calculus my senior year, before becoming an English major in college so I could bullshit my way through things easier.
The publisher does not guarantee the accuracy or completeness of the information provided in this page. These are not the opinions of any of my employers, partners, or associates. I did my best to be honest about my disclosures but can’t guarantee I am right; I write these posts after a couple beers sometimes. I edit after my posts are published because I’m impatient and lazy, so if you see a typo, check back in a half hour. Also, I just straight up get shit wrong a lot. I mention it twice because it’s that important.
Great read Chris. Isn't the US dollar the ultimate ponzi scheme? We are the largest buyers of our own debt. We print paper in one room, and buy it from ourselves in the other room....40 trillion times, backed by nothing. I do think gold is the ultimate hedge. If some nation(s) create a silver backed currency, AG will be a good hedge. I still think there is a 5% chance bitcoin is a hedge against the dollar ponzi. I look at bitcoin like, home, auto, and life insurance. I hope all of that money goes it waste, but in a catastrophic unlikely event, it might pay off.
Oh look it’s an uninterrupted series of the same message from Schiff. What is the record for repeating the crash message and claiming correlation random years?
The remarkable fact is that over 40 years, Berkshire didn’t just beat gold—it likely turned every $1 into roughly 8–10 times more wealth than gold did. The power of a few extra percentage points compounded for four decades is almost impossible to appreciate until you run the numbers.