
A Technical Analysis Look At Gold And Silver's Run
In this latest analysis, the market still looks very healthy but might be due for another consolidation period before attempting $4000 gold and $50 silver.

This analysis attempts to look at different metrics to understand the current momentum in the gold and silver markets. It is meant as an analysis on potential price direction in the very short-term (a few weeks to 1-2 months).
The last technical analysis in June highlighted that the gold market still looked strong despite big price jumps higher. That conclusion proved accurate as the price has continued to build on recent gains and silver has finally broken out to the upside.
In this latest analysis, the market still looks very healthy but might be due for another consolidation period before attempting $4000 gold and $50 silver.
Price Action
Gold and silver continue to climb higher and higher in a very strong bull market. Very little attention has been paid to the massive price increase over the last few years. There was a recent article that highlighted how gold has crushed the stock market when looking back over 25 years.
Still, even with the price moving ever higher, the action does not look unhealthy. The last two months have seen consolidation in gold while silver caught up. Then both have taken another leg higher.
Outlook: Bullish
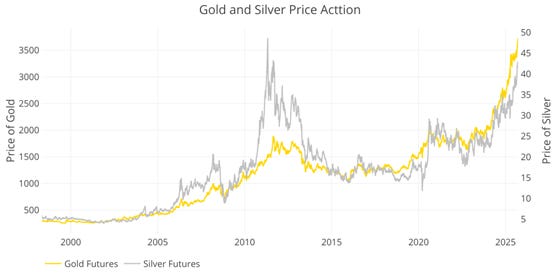
Figure: 1 Gold and Silver Price Action
Daily Moving Averages (DMA)
Gold
The 50 DMA has been above the 200 day for over a year now. This confirms the bullish trend is intact. The price has pulled away from the 50 DMA again which will likely lead to consolidation in the near-term.
Outlook: Neutral
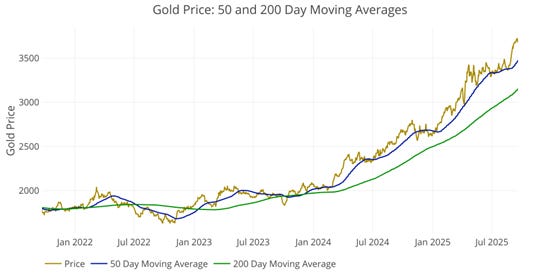
Figure: 2 Gold 50/200 DMA
Silver
Silver had been trending in a similar way, but recently shot up big time and may need a bit of time to cool off. Then again, it had some serious catching up to do. Similar to gold, it likely needs time to consolidate.
Outlook: Neutral
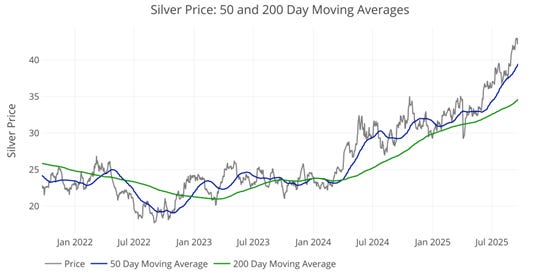
Figure: 3 Silver 50/200 DMA
Comex Open Interest
Gold
The latest price pop has happened with a big move higher in open interest. The total open interest had been incredibly low so it is now at around average. That said, this tends to be “hot” money that will bail at the first sign of trouble. Open interest is not excessive yet, but it has definitely absorbed cash on the sidelines.
Outlook: Neutral
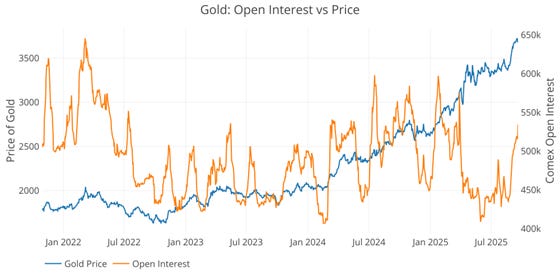
Figure: 4 Gold Price vs Open Interest
Silver
Silver open interest has come off the recent highs and has actually increased. This is a very bullish sign showing that the recent price action is not driven by hot money like gold.
Outlook: Bullish
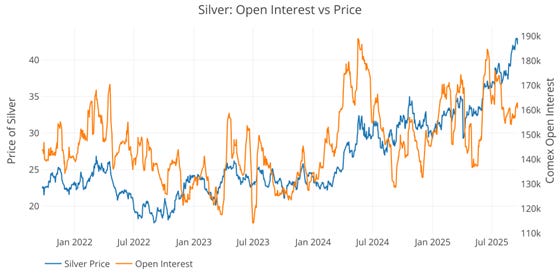
Figure: 5 Silver Price vs Open Interest
ETF Shares Outstanding
GLD and SLV are the two most popular ETFs that track Gold and Silver. While institutions will buy these funds, this data generally shows retail interest. The chart shows the price and shares outstanding. Shares outstanding is the metric that shows overall retail interest.
Gold
Retail is mostly sitting on the sidelines during this bull market. They have started buying in recently, but no big moves. It looks like just slow accunulation. Retail can be a contrarion indicatior which makes this chart bullish.
Outlook: Bullish
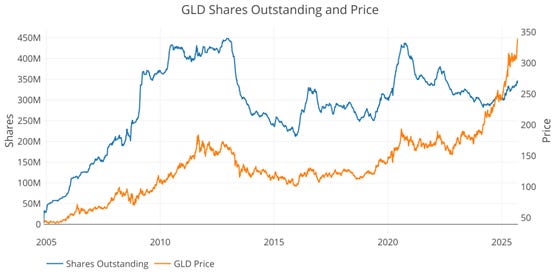
Figure: 6 ETF Analysis
Silver
SLV has seen a little bit of a pop as the recent price spike happened, but it is still well below highs from 2022.
Outlook: Bullish
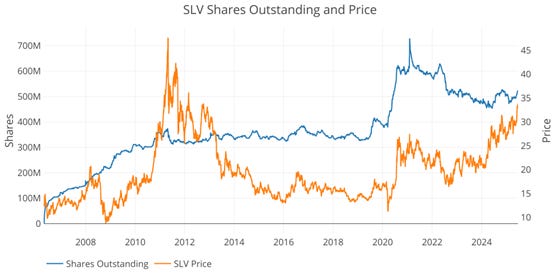
Figure: 7 ETF Analysis
Margin Rates and Open Interest
The CME uses margin requirements to pull momentum out of the futures market. This is usually done to halt explosive up moves and contain them, but can be used in quick bear markets as both shorts and long are subject to margin requirements. Margin increases force traders to put up more capital or sell off contracts to meet requirements. Managed Money (see CoTs report) are more sensitive to margin increases as they tend to be more levered and capital constrained, so margin increases typically force them to liquidate positions (if they are long prices go down as they sell and if short prices go up). More often, traders are long and higher margin causes forced selling.
Gold
Margin rates have been pushed to their highest level on recent record. There was another hike in margin rates in this latest week and the gold price didn’t even blink. This is a very bullish sign.
Outlook: Bullish
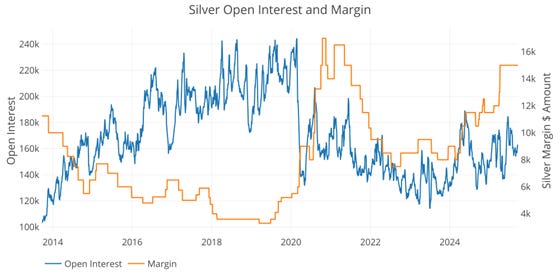
Figure: 8 Gold Margin Dollar Rate
Silver
The last Margin increase came in April which was a big move up. This still looks quite bullish. Margin rates are not yet at all time highs, but they are very elevated and it has done little to dent the price.
Outlook: Bullish
Figure: 9 Silver Margin Dollar Rate
Gold Miners
For short-term moves, the gold miners have been consistently leading the price of gold in both directions for years (i.e., if GDX starts selling off it usually indicates gold will come under pressure). The GDX got slammed in the pullback from the election and gold followed suit. Despite this relationship, the miners have a harder time recovering from big sell-offs. It leads in direction, but not in magnitude. For example, while gold has shot past all-time highs, GDX has only just reached the October levels.
GDX has been very strong indicating that there seems to be momentum behind the gold market. It has risen over 100% YTD. Stock investors are starting to believe in this gold market.
Outlook: Bullish
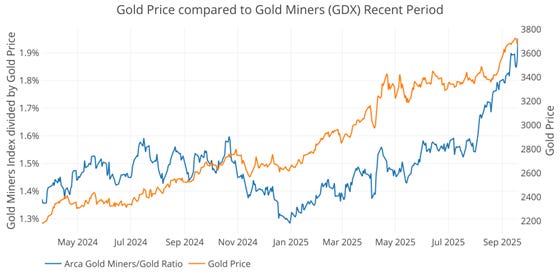
Figure: 10 Arca Gold Miners to Gold Current Trend
The chart above showoing a big move YTD would possibly give reason for concern, but the chart below should put those concerns to rest. The GDX remains deeply undervalued. Considering the YTD move, it may have some consolidation, but the market finally looks strong. This is a very bullish sign.
Figure: 11 Arca Gold Miners to Gold Historical Trend
Trade Volume
The final indicator is trade volume on the CME. This is related to, but not exactly tied to open interest. Higher trade volume with flat open interest can mean churn. Higher trade volume can also be met with increases or decreases in open interest if buyers or sellers are in control.
In gold, the new high prices have NOT been driven by elevated volume. It’s quite shocking to see how normal the market looks as the price has exploded higher this year.
Outlook: Bullish
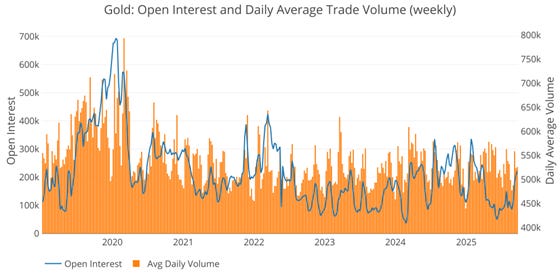
Figure: 12 Gold Volume and Open Interest
Silver is in the same boat, reaching new highs with average volume.
Outlook: Bullish
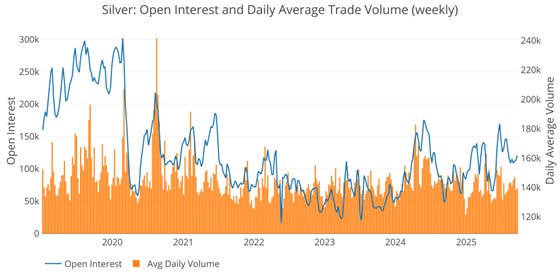
Figure: 13 Silver Volume and Open Interest
Conclusion
Gold has been very strong and silver is on an absolute tear. While this could lead to consolidation in the near-term, nothing about this market looks frothy. In fact, besides the simple price action, nothing is pointing towards a market that needs time to consolidate.
The indicators are all neutral to bullish which suggests that consolidation may be warranted but the price could also just keep moving higher. In either case, the downside looks limited at this point.
Interested in learning how to buy gold and buy silver? Call 1-888-GOLD-160 and speak with a Precious Metals Specialist today!

QTR’s Disclaimer: Please read my full legal disclaimer on my About page here. This post represents my opinions only. In addition, please understand I am an idiot and often get things wrong and lose money. I may own or transact in any names mentioned in this piece at any time without warning. Contributor posts and aggregated posts have been hand selected by me, have not been fact checked and are the opinions of their authors. They are either submitted to QTR by their author, reprinted under a Creative Commons license with my best effort to uphold what the license asks, or with the permission of the author.
This is not a recommendation to buy or sell any stocks or securities, just my opinions. I often lose money on positions I trade/invest in. I may add any name mentioned in this article and sell any name mentioned in this piece at any time, without further warning. None of this is a solicitation to buy or sell securities. I may or may not own names I write about and are watching. Sometimes I’m bullish without owning things, sometimes I’m bearish and do own things. Just assume my positions could be exactly the opposite of what you think they are just in case. If I’m long I could quickly be short and vice versa. I won’t update my positions. All positions can change immediately as soon as I publish this, with or without notice and at any point I can be long, short or neutral on any position. You are on your own. Do not make decisions based on my blog. I exist on the fringe. If you see numbers and calculations of any sort, assume they are wrong and double check them. I failed Algebra in 8th grade and topped off my high school math accolades by getting a D- in remedial Calculus my senior year, before becoming an English major in college so I could bullshit my way through things easier.
The publisher does not guarantee the accuracy or completeness of the information provided in this page. These are not the opinions of any of my employers, partners, or associates. I did my best to be honest about my disclosures but can’t guarantee I am right; I write these posts after a couple beers sometimes. I edit after my posts are published because I’m impatient and lazy, so if you see a typo, check back in a half hour. Also, I just straight up get shit wrong a lot. I mention it twice because it’s that important.
The bull run has been with interest rates held at a higher level and QT going on. With a loosening phase beginning, metals could soar. Gold just consolidated for months, so it’s not obvious to me that we’re due for another consolidation any time soon.
Good article on a day where my mineral stocks are not doing much.