A "Debt Doom Loop" Is Now Fully Engaged
"Rivets are popping. We have seen this movie before. The Fed tightens, things break, the Fed reacts by opening the monetary flood gates and the cycle begins all over again."
Friend of Fringe Finance Lawrence Lepard released his most recent investor letter this week, with his updated take on the state of macro heading into 2023.
I truly believe Larry to be one of the muted voices that the investing community would be better off for considering. He’s the type of voice that gets little coverage in the mainstream media, which, in my opinion, makes him someone worth listening to twice as closely.
You can listen to his most recent public podcast appearance on Palisades Gold Radio, from about 3 weeks ago, here.
But for this week, Larry was kind enough to allow me to share his thoughts heading into Q1 2023. His letter has been edited ever-so-slightly for formatting, grammar and visuals.
This is part 2 of his letter. Part 1 can be read here.
RIVETS ARE POPPING
We have seen this movie before. The Fed tightens, things break, the Fed reacts by opening the monetary flood gates and the cycle begins all over again. Before things break you generally see signs that trouble is coming. We call this rivets popping.
There is always a lag effect between monetary policy and economic results. This current period reminds us of Summer 2007 when the Bear Stearns CDS funds failed. The GFC was 15 months later in the second half of 2008.
One very large rivet that has already popped is Great Britain as we described above. Another hugely important rivet that has not popped yet, but in our opinion is close is the US Stock Market.
We think the pain has just started. Particularly in the stock market where as the chart below shows, street estimates (blue bars) are looking for continued earnings growth as if no recession is imminent. Green bars show earnings decline in recessions. The economy is slowing rapidly and will almost surely enter a recession given the record inversion in the yield curve as seen in the 2year/10year bond spread. With softening demand and increased labor costs, earnings will suffer. The Wall Street analysts who are projecting further earnings growth are on drugs in our opinion. Additionally, with higher interest rates, price multiples to earnings will compress.
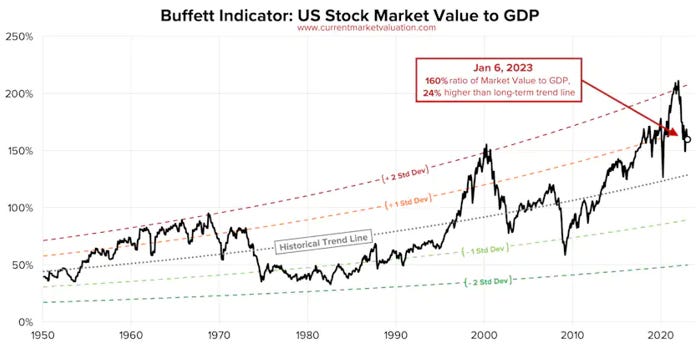
As you can see in Warren Buffett’s key market indicator in the chart below, compared to GDP stocks are still valued at 2000 levels. Recall that from that level the stock market declined 50% when the Dotcom bubble burst. Stocks are not cheap.
Additional rivets include the US Housing and Used Car Markets both of which show significant evidence of an economic slowdown as described in charts we have already covered above.
Some more recent rivets are as follows…
Japan was forced by the market to abandon yield curve control designed to hold their 10 year note yield at 25 bps. They moved the target to 50 bps. What is shocking is that even after moving the target they have still had to conduct record amounts of bond purchases and now the market yield is OVER 50 bps. The new target is not holding. As Robin Brooks says:
The next rivet to pop this year was in early December when the Blackstone Real Estate Income Trust (BREIT) put up withdrawal gates for investors. BREIT is a $70 Billion private trust, largest in the US, that owns 5,000 properties and offered high yields to attract investors. It financed these properties using shorter term borrowing. The increase in rates has harmed the returns and investors want out. The problem is that real estate is not immediately liquid. Investors are going to learn a hard lesson here about using leverage and illiquid assets. It is also notable that commercial office space in Manhattan is still showing a 50% vacancy rate. The assets here will have to be marked down and the debt will become impaired. Only days after BREIT took the step of halting withdrawals, the Starwood Real Estate Trust ($17B in size) took the same step.
The next rivet has to do with US Government interest expense. Have a look at the slope on this curve.
The rapidly growing US Federal interest cost rivet contributes to the US Fiscal Budget rivet:
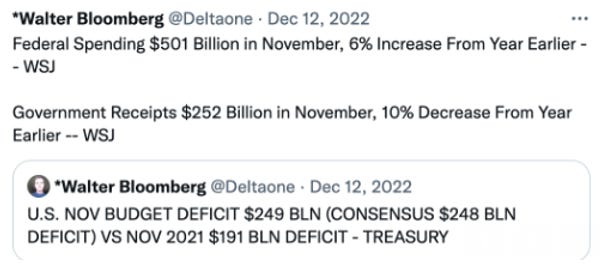
In terms of the federal budget, we can see from the Tweet above that as we had expected tax receipts are falling by 10% y/y and expenses are increasing by 6% y/y. In earlier reports, we have chronicled how the fiscal (September) 2022 US Federal deficit was $1.38T[1], down substantially from the $2.77T and $3.13T deficits of 2021 and 2020, respectively. We believe this 2022 level was an anomaly that will not be repeated since it included a one time boost of $600B in capital gains taxes collected due to the huge stock market rally in 2021. In addition, Congress passed several spending bills and cost of living adjustments boosted Social Security and Medicare costs by 8.7%. Also factor in that interest costs on the debt are up substantially, and we think the US is easily looking at a 2023 budget deficit of between $2.0 and $3.0T.
This estimate is supported by Luke Gromen’s forensic analysis of the TBAC (Treasury Borrowing Advisory Committee) estimates of the amount of debt issuance that will be necessary to finance the Federal Government in Q4 2022 and Q1 2023. TBAC suggests that the US Federal Deficit is running at a $2.4T annualized rate. If taxes fall further and additional spending is enacted this could swell from that level. A deficit of between $2.0 and $3.0T will just add to the burden of treasury debt that needs to be sold and will also be added to the total US Federal debt outstanding which is presently $31.5T.
At a big picture macro level, the economic downturn that is about to ensue due to the Feds aggressive tightening actions is completely misunderstood and under rated in our opinion. Real estate is in the process of rolling over and ultimately employment will follow. People behave and spend based upon their level of wealth and when the biggest asset they own, their home, begins to decrease in value they are going to pull back.
Most of the country looking at their stock portfolios down 20% this year think to themselves - it will be OK. We should buy the dip. It has worked since 2009. This is where they are going to get surprised. When the stock market is down another 20 to 30% in 2023 as we believe it will be, then the real pain begins. At that point you have a real economic downward spiral and the Fed will be forced to pivot or else watch the Great Depression II unfold. Suddenly inflation will no longer be the Fed’s top concern. A collapsing economy will lead to monetary easing.
We believe that when either enough rivets pop, or the downturn occurs and becomes fully obvious, the Fed will be forced to pivot and will have to print until their eyes bleed. This will completely destroy their last remaining shred of credibility and our portfolio will perform well again.
DEBT DOOM LOOP FULLY ENGAGED
So as we have described above, the Fed has slammed on the monetary brakes, the “Everything Bubble” has popped. All that remains is for the Fed’s actions to trigger enough pain that something will break and suddenly the Fed will no longer view its primary job as fighting inflation but will instead be concerned about “financial stability” as it was in March 2020. Without monetary expansion and growth in M2, the debts of the world become unserviceable and will collapse. Full stop
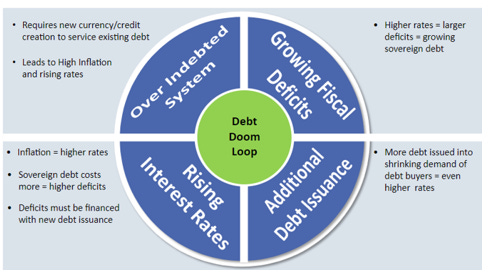
As we’ve discussed in previous letters, the US Treasury and the Fed are trapped in what we call a debt doom loop. The chart below lays out this circular process.
Stated simply, excess government debt and deficits, financed via money printing and M2 growth drive inflation higher and then become problematic when interest rates rise and thereby make interest costs higher. Higher interest costs lead to larger deficits which lead to the need to finance more debt which in turn leads to higher interest rates -exacerbating the problem. These have occurred in third world and developing countries for years and the end result is always massive inflation and/or currency collapse. We have not seen a debt doom loop take place in a large developed country since the early part of the 20th century and the most famous is the Weimar hyperinflation which culminated in the collapse of the Reichsmark in 1923.
ZOLTAN POZSAR’S THESIS: DE-DOLLARIZATION IS PLAYING OUT
Because of 2022’s combination of wars, commodity nationalism, mis-trust following assets seizures and de-globalization generally, gold matters again. Like Credit Suisse analyst Zoltan Pozsar, we see a world where the idea of “what” is a suitable neutral reserve currency is changing.
Mr. Pozsar recently published several reports outlining important developments in the currency and asset markets. In short, his thesis is that the seizure of Russian assets in Spring 2022 has accelerated the trend toward what he labels as Bretton Woods III, a monetary system built upon a more multi-polar set of neutral reserve assets including gold, oil, natural gas and other commodities. He points to China President Xi’s recent visit to Saudi Arabia (leader of the Gulf Co-operation Council (GCC) states) to push for settlement of China/GCC oil transactions in Yuan, by-passing the dollar. Behold the birth of the Petroyuan. This is a very big deal leading to the decline of the US Dollar as the world’s reserve currency.
Zoltan’s argument is lengthy and detailed and when we read his December 27, 2022 piece we were shocked at how developed the efforts were by many foreign countries (including China, Russia and India) to replace the dollar. In the mirror image of US Treasury Secretary John Connolly who in 1971 said “our currency, your problem” the new emerging bloc of countries (arguably BRICs plus GCC) are saying “our commodities, your problem”. These countries are increasingly less willing to transact in or store value in Western currencies like the Euro or the Dollar.
This may appear to be innocuous, but it has enormous inflationary implications for the West. With the new Petroyuan, the Chinese can print currency to pay for oil in the same way that the Petrodollar allowed us to do the same. Zoltan concludes that western investors and policy makers are severely mispricing future inflation rates in dollar terms. He foresees a decades long period of high inflation ahead. We agree.
GOLD AND GOLD MINER SECTOR OUTLOOK
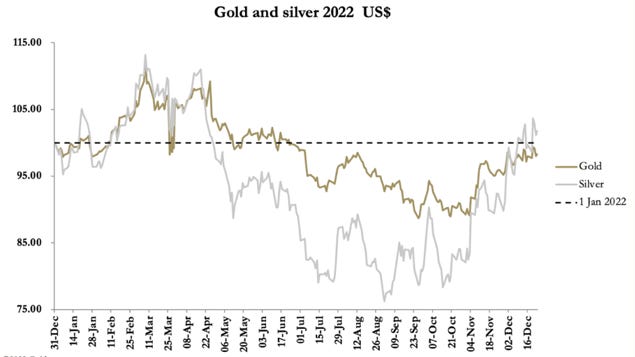
With all of the monetary chaos describe above it is not surprising to us that the performance of gold and silver were substantially better in the fourth quarter. In our opinion, gold and silver have started to sniff out the monetary debasement, which is likely to be coming, and we believe that the lows are in for this 2-year cycle. We could envision one more correction in the precious metals if the US Stock market collapses or we have a liquidity event like March 2020. In such an event, we believe the correction would be sharp but brief like it was in 2020.
Notice in the chart above how well silver and gold performed in the fourth quarter. Also, notice that silver led gold which has traditionally happened at the beginning of new bull runs in the precious metals.
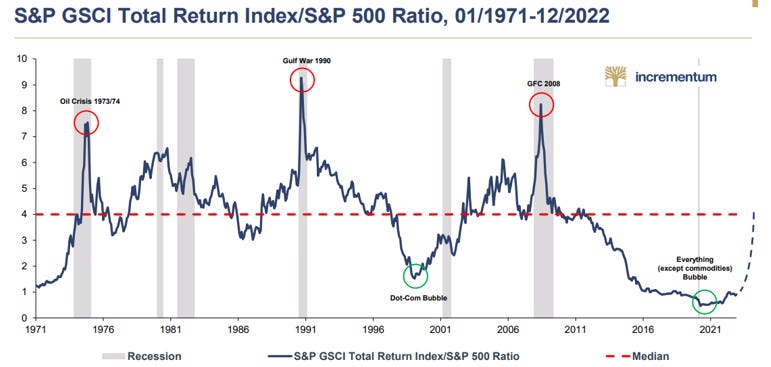
Zooming out, precious metals and other commodities remain incredibly cheap relative to global financial assets as the following graph shows. Commodity prices would need to rally 3x JUST to get back to the 52 year Median price level for commodities! Further, you can see that during major deficit / inflation spending eras, commodities tend to overshoot. As discussed earlier, we are beginning that cycle again.
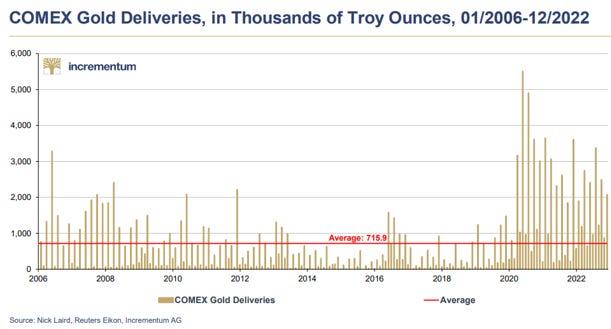
We believe that we have seen a secular change in the deflation/inflation conditions and that things are beginning to turn – and not just in terms of monetary debasement and inflation; gold demand is jumping as physical demand for gold has notably increased since the 2020 Print-A-Thon.
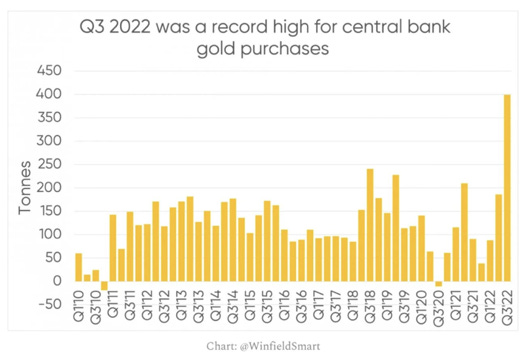
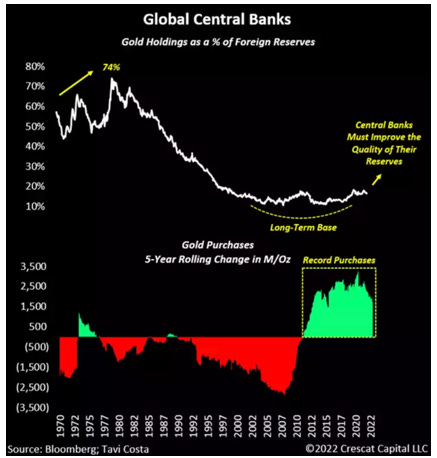
Central banks have also increased their interest in gold. The World Gold Council’s third quarter report shows Central Bank purchases of gold at the highest level in 47 years.
As you can see below, gold was once a much more important part of Central Bank reserves:
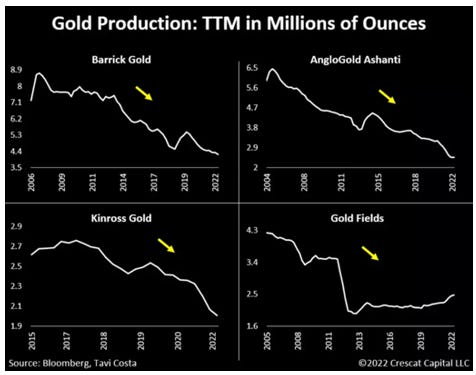
Gold supply and demand is setting up to be very tight given the industry has underinvested in new capacity and finding reserves. In fact, more recently, production, reserves and grades have been shrinking. Any increase in demand is not going to be easily met by an industry that has been shrinking. Furthermore, the major miners, many of whom are de-leveraged with no debt and large cash balances are going to need to look for the junior companies that we own to sustain their levels of production.
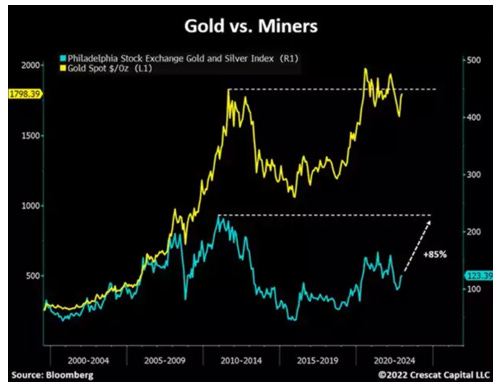
Furthermore, the gold and silver mining stocks are very cheap and are disconnected from the underlying metals prices as shown in the next chart. The miners reflect future gold price expectations. When the market realizes that gold is going to $2,500 and not $1,500, the miners will explode to the upside.
In our view we have a large and diversified portfolio of the best gold and silver miners and these companies are all worth multiples of their present value if gold and silver continue to trend higher.
SILVER OUTLOOK IS VERY BULLISH
As much as we are bullish on gold, Silver is even more asymmetric in terms of upside performance. First, silver is very cheap compared to monetary aggregates as the next chart on Silver demonstrates.
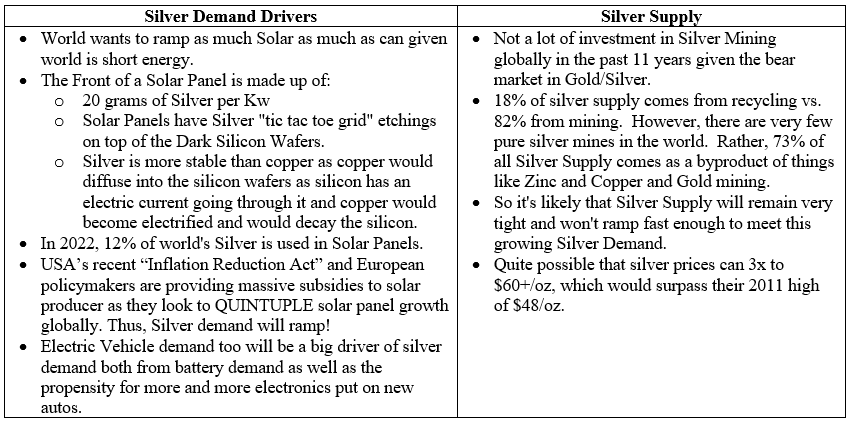
Beyond the monetary metal tailwinds for silver, the industrial demand for silver will far outstrip silver supply over the next few years as we outline below:
Finally, as Katusa Research points out, silver miner’s market cap are a blip compared to the market caps of other market segments. Thus, any marginal tightening of the silver market tends to amplify the upside in the silver mining stocks rapidly.
BITCOIN IS NOT CRYPTO
The blow up of the massive FTX crypto fraud has cast a dark shadow on all crypto/digital currencies and caused some to question our investments in Bitcoin. We believe the following:
Bitcoin is a completely different animal than all other (20,000+) crypto currencies. Bitcoin has been declared a commodity by the SEC and it has no CEO or management team that can harm it. It is fundamentally different from Celsius, Luna, FTX, Ethereum and all the other tokens that we believe are illegal, unregistered securities.
Bitcoin is a technological invention that provides immutable digital scarcity. If Bitcoin adoption continues at its present pace, we expect that it may grow to become a form of digital gold. Having said this, we are in the early development stage, and its price is extremely volatile. This year it has been made more volatile by the failure of other tokens pretending to be Bitcoin. We believe Bitcoin has more upside optionality than gold. As Paul Tudor Jones said "it is the fastest horse in the monetary debasement race". In 2020-2021 Bitcoin appreciated by 500%. Gold has never done this. Now, it also corrected 70% off that peak; nevertheless, it is still trading at a higher low ($17,000 versus the 2019 low of $3,500).
As Managers of a "protect against monetary debasement fund" we believe that to not have ourselves exposed to Bitcoin would be big mistake. The upside optionality is too large. However, because of the volatility we have kept the weight modest.
In terms of the Fund’s investments in the Bitcoin space: We have kept the Bitcoin weighting modest relative to the gold and silver miners. Presently about 12% of the Fund’s assets are in Bitcoins or private companies that are attractive venture capital opportunities. When Bitcoin was at $68,000 this weighting was higher but only based upon price appreciation. Our current valuation and cost basis are roughly the same.
EXAMPLES OF CHEAP STOCKS IN THE PORTFOLIO
We hold a diversified portfolio of gold and silver mining stocks in 3 different buckets. One strong example from each bucket is summarized below.
Large Growing Producer
Argonaut Gold. Ticker: AR cn (Market Cap: $414 million)
· New CEO, Richard Young is world class and successfully built Teranga Gold and sold it to Endeavour Mining (EDV-TC). Personally purchased 2.17 million shares for ~ US$700K of since joining in December 2022.
· Argonaut has 4 operating mines, 3 in Mexico and 1 in Nevada generating $125 million of annual mine operating profit on 200,000 ounces of production.
· Flagship new Magino mine in Canada is 70% complete, fully financed and will begin production in Q4 2023.
· Magino will add at least 150,000 oz / year of gold production and that figure will grow.
· With over 350,000 oz/year production, Argonaut will conservatively be worth $2.0 Billion or over 5x today’s value.
· The Company is in a safe jurisdiction, with top tier management and has huge reserves of over 20 million ounces.
Small Emerging Producer
Guanajuato Silver. Ticker: GSVR cn (Market Cap: US$99 million)
· Mexican based emerging silver producer. 2.5 year old producer currently running at 3 million AgEq Oz/year. Will exit 2023 at 6mm ozpa. Plan is to grow to 10+ million ounces of AgEq production within 4 years.
· Cash cost of ~$14.60 per ounce. Yields mine profit rate of $32 million at $20 silver. $30 silver (which we expect) yields mine profit run rate of $92 million late 2023.
· Management: James Anderson and Ramon Davila. Ramon was COO of First Majestic throughout their entire growth period. First Majestic market cap is $2 billion. (down from $4 billion before this pull back)
· GSVR operates 3 mills and 4 mines and has 24.8MM AgEq oz of resource. Purchased the Guanajuato assets of Great Panther for $16 million when they were valued at $80 million. Doubling size of Company production and deposits.
· GSVR’s market cap is at $99 million and we anticipate that it could easily trade at 5x mine profits at $30 silver. This would represent a 400% return from the present valuation (and this does not take into account our warrants which will enhance this return materially).
Drill Story
Lavras Gold. Ticker: LGC-VC. (Mkt. Cap. $12m USD)
· Brazilian drill story spun out from Amarillo Gold. ~ 1 million ounces in 43-101 all category.
· 10km wide Caldera/Alkaline gold deposit with 1.5gpt intercepts all over surface and high grade intercepts (15m @ 5.78gpt, 3m @28.24 gpt, 1m@ 61gpt ) just being drilled.
· We believe this is a 2-5 million ounce deposit which at the low end of resource valuations ($40 per ounce) would be worth $80 to $200 million. (10x to 24x upside)
· Lepard on Board of Directors Lavras
About Larry Lepard
Larry manages the EMA GARP Fund, a Boston based investment management firm. Their strategy is focused on providing "Monetary Debasement Insurance". He has 38 years experience and an MBA from Harvard Business School. On Twitter he is @LawrenceLepard Managing Partner and, via email, he is llepard@ema2.com
Disclaimer: QTR is long various gold and silver miners and have both long and short exposure to the market through equities and derivatives. I have no position in Larry’s funds. Larry is a subscriber to Fringe Finance and has been on my podcast. The excerpts from Larry’s letter, above, shall not be construed as an offer to sell, or the solicitation of an offer to sell, any securities or services. Any such offering may only be made at the time a qualified investor receives from EMA formal materials describing an offering plus related subscription documentation. There is no guarantee the Fund’s investment strategy will be successful. Investing involves risk, and an investment in the Fund could lose money. The strategy is also subject to the following risks: Currency Risk, Non-US Investment Risk.
These presentation materials shall not be construed as an offer to purchase or sell, or the solicitation of an offer to purchase or sell, any securities or services. Any such offering may only be made at the time a qualified investor receives from EMA formal materials describing an offering plus related subscription documentation (“offering materials”). In the case of any inconsistency between the information in this presentation and any such offering materials, including an offering memorandum, the offering materials shall control.
Securities shall not be offered or sold in any jurisdiction in which such offer or sale would be unlawful unless the requirements of the applicable laws of such jurisdiction have been satisfied. Any decision to invest in securities must be based solely upon the information set forth in the applicable offering materials, which should be read carefully by prospective investors prior to investing. An investment in EMA not suitable or desirable for all investors; investors may lose all or a portion of the capital invested. Investors may be required to bear the financial risks of an investment for an indefinite period of time. Investors and prospective investors are urged to consult with their own legal, financial and tax advisors before making any investment.
The statements contained in this presentation are made as of the date printed on the cover, and access to this presentation at any given time shall not give rise to any implication that there has been no change in the facts and circumstances set forth in this presentation since that date. These presentation materials may contain forward-looking statements within the meaning of US securities laws. The forward-looking statements are based on EMA’s beliefs, assumptions and expectations of its future performance, taking into account all information currently available to it, and can change as a result of known (and unknown) risks, uncertainties and other unpredictable factors. No representations or warranties are made as to the accuracy of such forward-looking statements. EMA does not undertake any obligation to update any forward-looking statements to reflect circumstances or events that occur after the date on which such statements were made. Historical data and other information contained herein, including information obtained from third-party sources, are believed to be reliable but no representation is made to its accuracy, completeness, or suitability for any specific purpose.
No representation is being made that any investment will or is likely to achieve profits or losses similar to those shown. Past performance is not indicative of future results. This report is prepared for the exclusive use of EMA investors and other persons that EMA has determined should receive these presentation materials. This presentation may not be reproduced, distributed or disclosed without the express permission of EMA.
QTR’s Disclaimer: I am not a financial advisor. I am an idiot and often get things wrong and lose money. I may own or transact in any names mentioned in this piece at any time without warning. This is not a recommendation to buy or sell any stocks or securities, just my opinions. I often lose money on positions I trade/invest in. I may add any name mentioned in this article and sell any name mentioned in this piece at any time, without further warning. None of this is a solicitation to buy or sell securities. These positions can change immediately as soon as I publish this, with or without notice. I may have positions in names mentioned in this article through ETFs other other means that I don’t know of off the top of my head. You are on your own, with your personal financial adviser. Do not make investing decisions based on my blog. I exist on the fringe. I may not have vetted the accuracy or completeness of work I have aggregated from other sources or that has been contributed to my blog. The publisher does not guarantee the accuracy or completeness of the information provided in this page in general. These are not the opinions of any of my employers, partners, or associates. I did my best to be honest about my disclosures but can’t guarantee I am right; I write these posts after a couple beers sometimes. Also, I just straight up get shit wrong a lot. I mention it twice because it’s that important.









I have to disagree with the BREIT notes. I am an investor in it and the yield was only 4.5% range – which I do not consider to be a “high yield”.
In addition 90% of their debt was locked in at a fixed rate for 6 years – so short term rates increasing should not have an impact on the fund. They do not have commercial office space in Manhattan in the portfolio. They are currently in the 95% range of occupancy. The financial crisis in 07-09 - obviously had the over leverage of CDS and other crap. But also the mark to market accounting was a downfall for many banks. IF there was a mortgage for $500K - but if the mark to market accounting was saying the house was worth $300K - they had to mark it down on their books - even if the borrower was making their mortgage payments.
If BREIT owns an apartment building that on paper may have dropped 20% in mark to market value - but is still 100% rented and everyone is making their payments - i am willing to ride it out.
For the gold conversation – I am more asking questions because I do not know the answer. From google – it appears the US Government owns $5T of gold. Which is a drop in the bucket of how much “currency” we have out there. As the biggest gold owner in the world – my question is “Is there enough gold in the world to back any currency at this point? Or you make the case that gold is should be worth $100,000 oz?”
Still learning a lot about this but the difference between Larry’s outlook and Kenny’s seem to be very stark. Perhaps it’s a difference in philosophy?? Kenny seems to be more of a DCA long term optimist while Larry sees a grim outlook in the near future and is looking to take advantage. Just me???